Documentation
Welcome to the sysAgent.ai documentation. This guide will help you set up, configure, and maximize the value of the ultimate Multi-OS System Administrator Agent.
Our platform combines traditional infrastructure monitoring with generative AI to give you a single, intelligent control plane for your entire fleet:
- Unified multi-OS management: Native support for both Linux (Ubuntu, Debian, CentOS, RHEL) and Windows (Server 2016+, Windows 10/11) from one dashboard, with real-time telemetry collected via procfs and WMI.
- AI-driven operations: Execute tasks in plain English (auto-translated to Bash or PowerShell), open live browser-based terminals, and let Autonomous Operations plan and run multi-step jobs with full transparency and approval gates.
- Proactive monitoring & self-healing: Build no-code monitoring checks, forecast outages with Predictive Analytics (disk, CPU, and memory), and resolve recurring incidents automatically with Auto-Remediation rules, on-call schedules, and maintenance windows.
- Security & compliance: Run hardening scans (OpenSCAP), CVE vulnerability detection, SSL certificate discovery with expiry alerts and replacement, File Integrity Monitoring, and generate audit-ready compliance reports (SOC 2, ISO 27001, HIPAA, DORA, NIS 2).
- Automation & insight: Generate OS-tailored Ansible playbooks, provision cloud infrastructure with AI-generated Terraform (AWS, GCP, Azure, VMware), optimize configuration files with AI, visualize dependencies on the AI Map, and auto-produce living infrastructure documentation.
- Enterprise-ready governance: Granular Role-Based Access Control, 2FA, Single Sign-On (SAML & OIDC), a full audit trail, and flexible notification channels keep operations secure and accountable.
Getting Started
1. Registration
First, create an account on our cloud platform. You will be assigned a unique Organization ID.
During login, you can optionally enable Two-Factor Authentication (2FA) for enhanced account security. We also offer granular Role-Based Access Control (RBAC), allowing you to define precise permissions for every system function and user.
2. Adding hosts
Once registered, open the Add Hosts view from the Add host button on the Agent Operations page. It is the single place to onboard a machine and offers two methods:
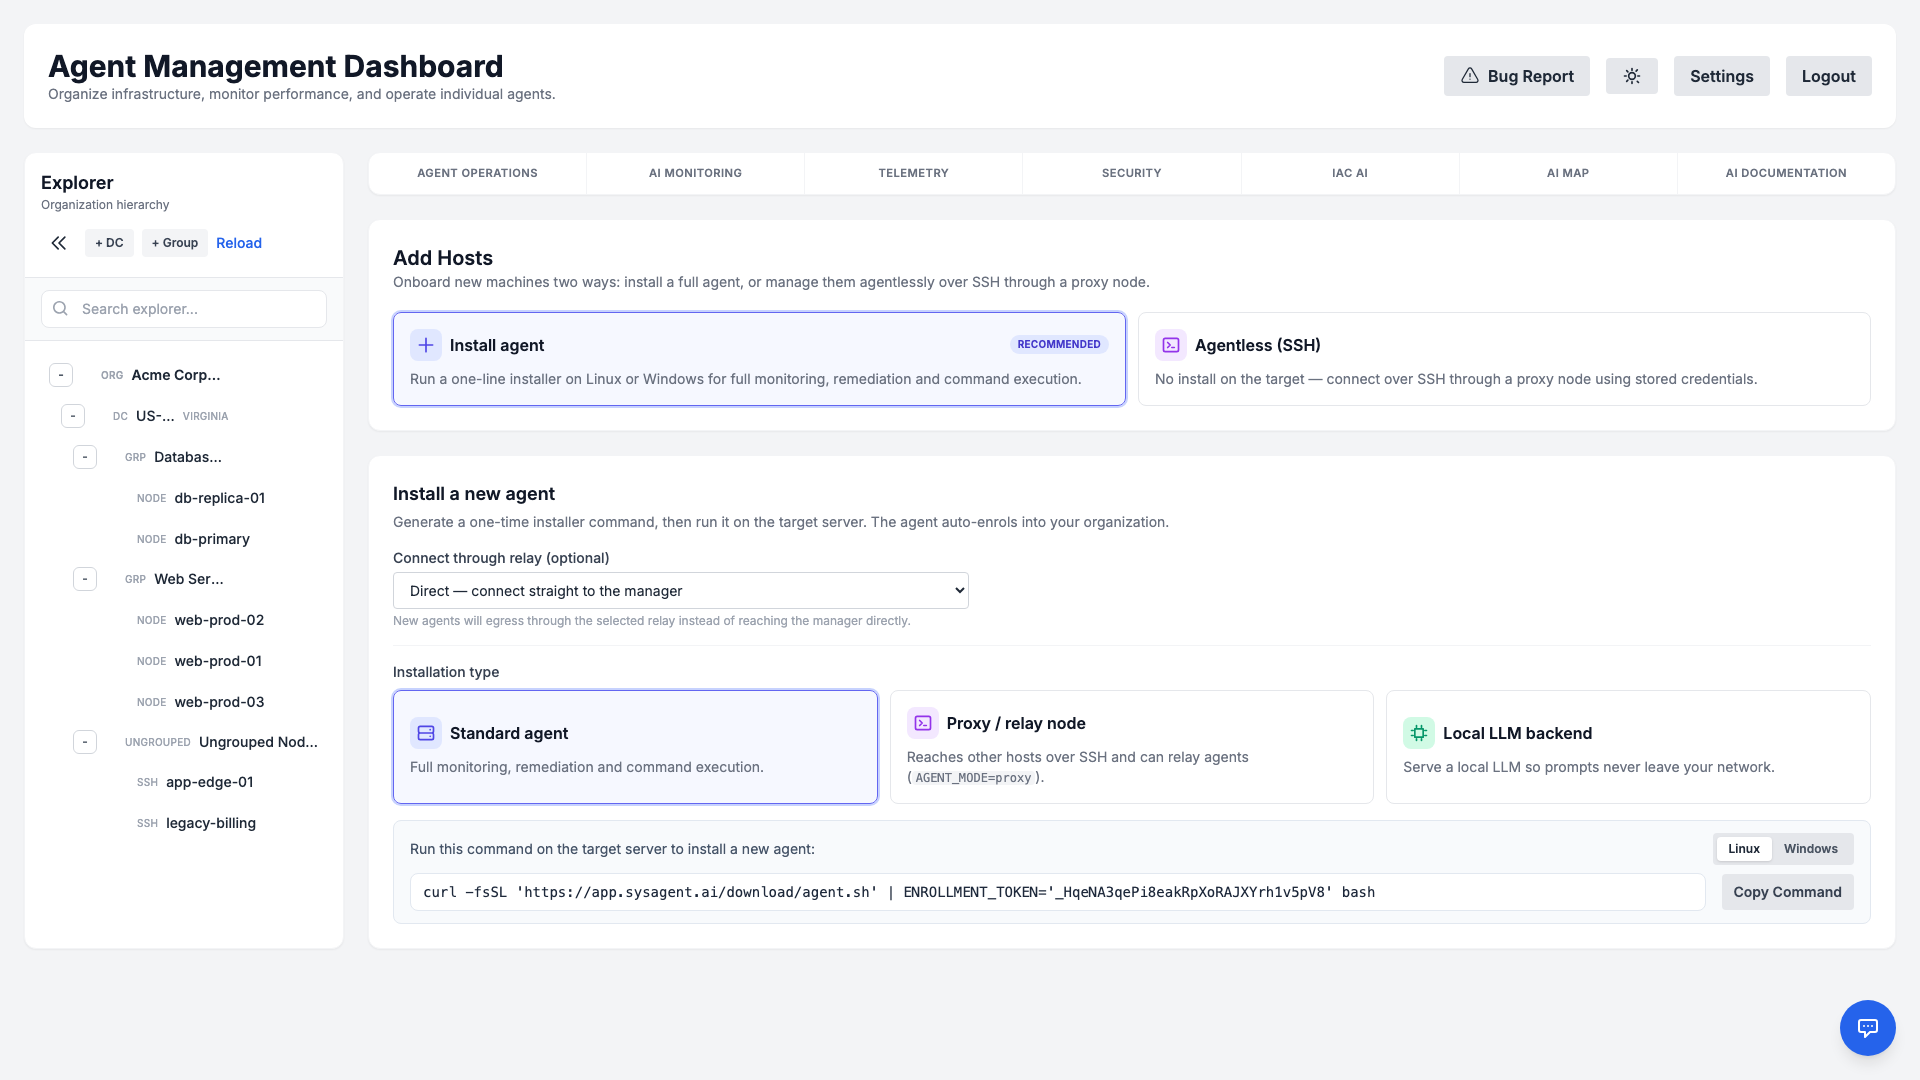
- Install agent (recommended) — generate a one-line installer command and run it on the target server for full monitoring, remediation, and command execution. The dashboard provides quick-copy commands for both Linux (Bash) and Windows (PowerShell), and the agent auto-enrols into your organization.
- Agentless (SSH) — manage a Linux server over SSH through a proxy node, with no software installed on the target (see Agentless SSH Hosts).
Install straight into a machine group
A host that enrols without a group lands under Ungrouped and has to be moved in the Explorer afterwards — an easy step to forget, and until it is done the host misses everything that is scoped to a group (feature opt-outs, configuration-drift baselines, group-targeted monitoring checks).
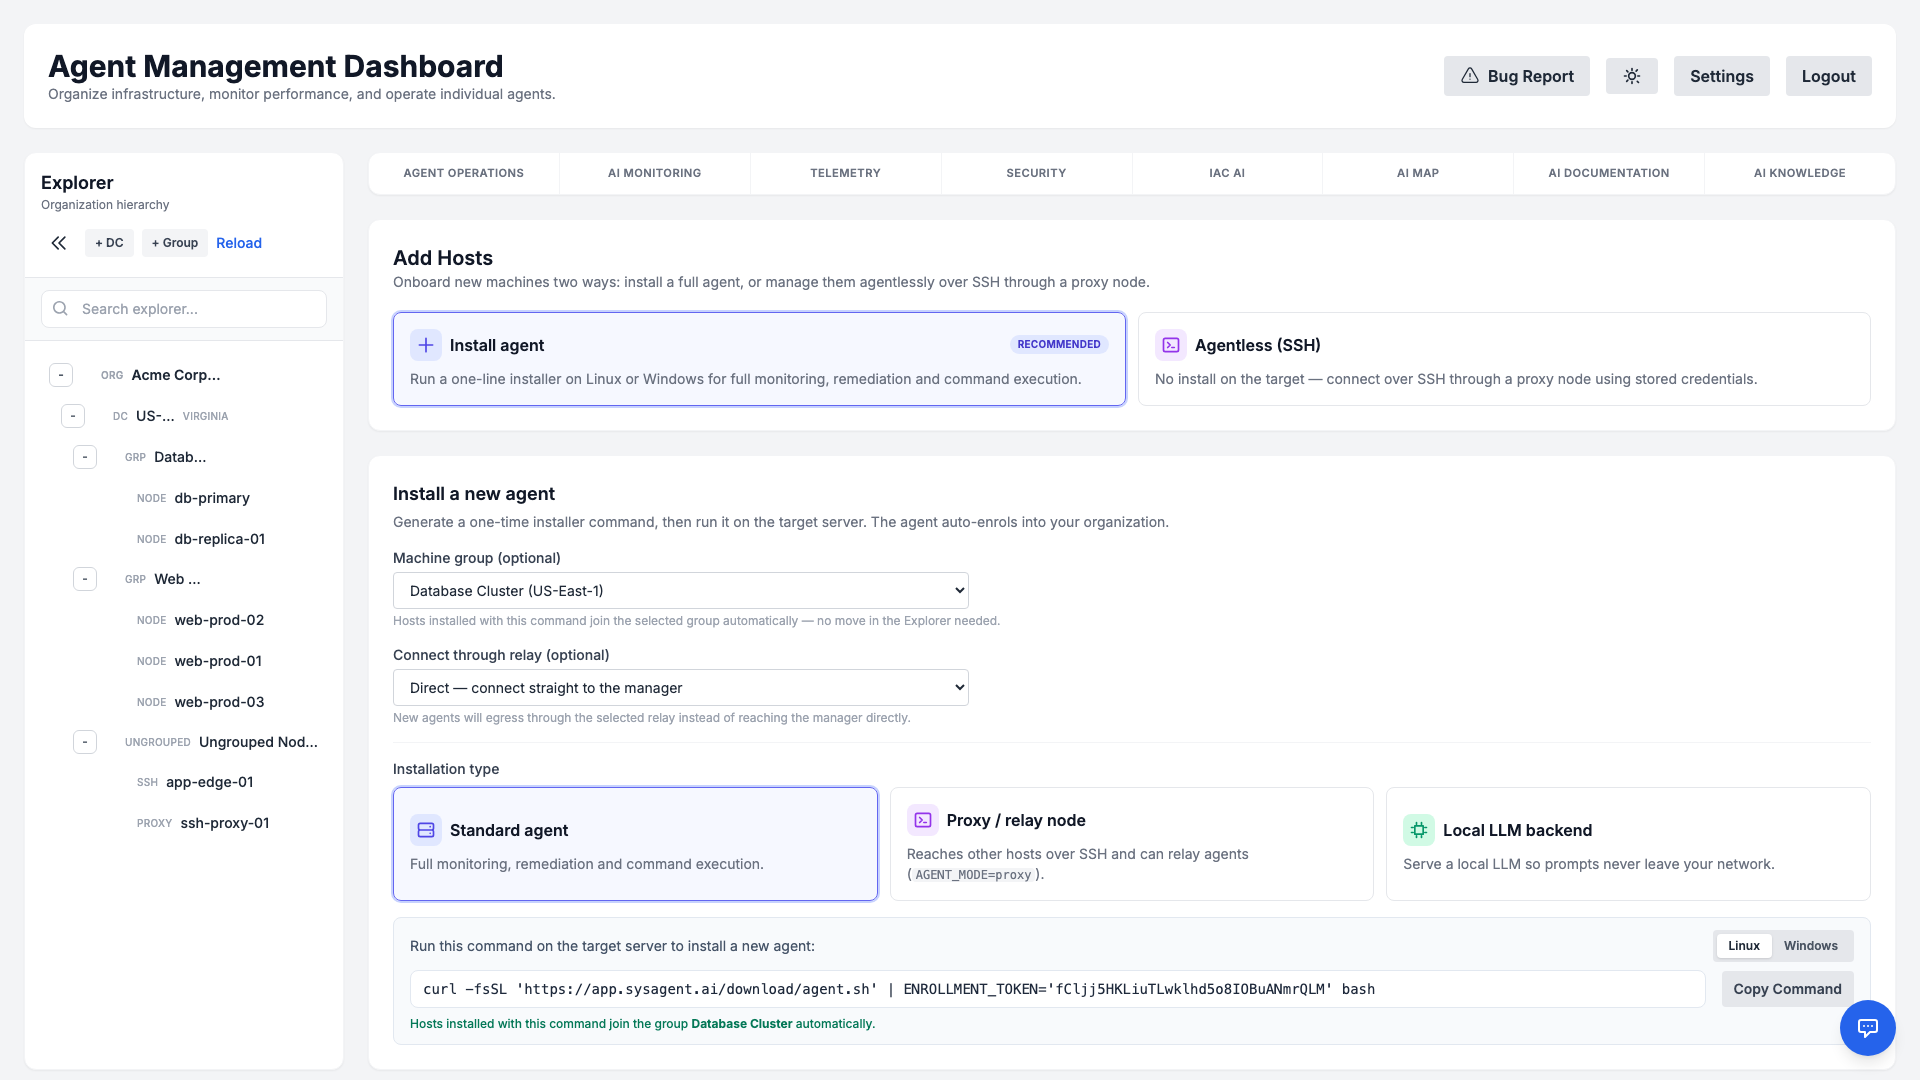
Pick the target under Machine group (optional) before you copy the command and every host installed with it joins that group on its first registration. The quickest route is from the Explorer itself: hover a group and click the ⤓ action — it opens Add Hosts with that group already selected. The generated command states in words which group it will join, and because a host can only belong to a group inside its own datacenter, choosing a group also fixes the datacenter for you.
Re-installing or re-registering an existing host never moves it — changing a host's group stays an explicit action in the Explorer.
For Linux (Ubuntu, Debian, CentOS, RHEL)
curl -sSL https://app.sysagent.ai/download/agent.sh | sudo bash -sFor Windows (Server 2016+, Windows 10/11)
Invoke-WebRequest -Uri "https://app.sysagent.ai/download/agent.ps1" -OutFile "$env:TEMP\agent.ps1"; & "$env:TEMP\agent.ps1"Agentless SSH Hosts
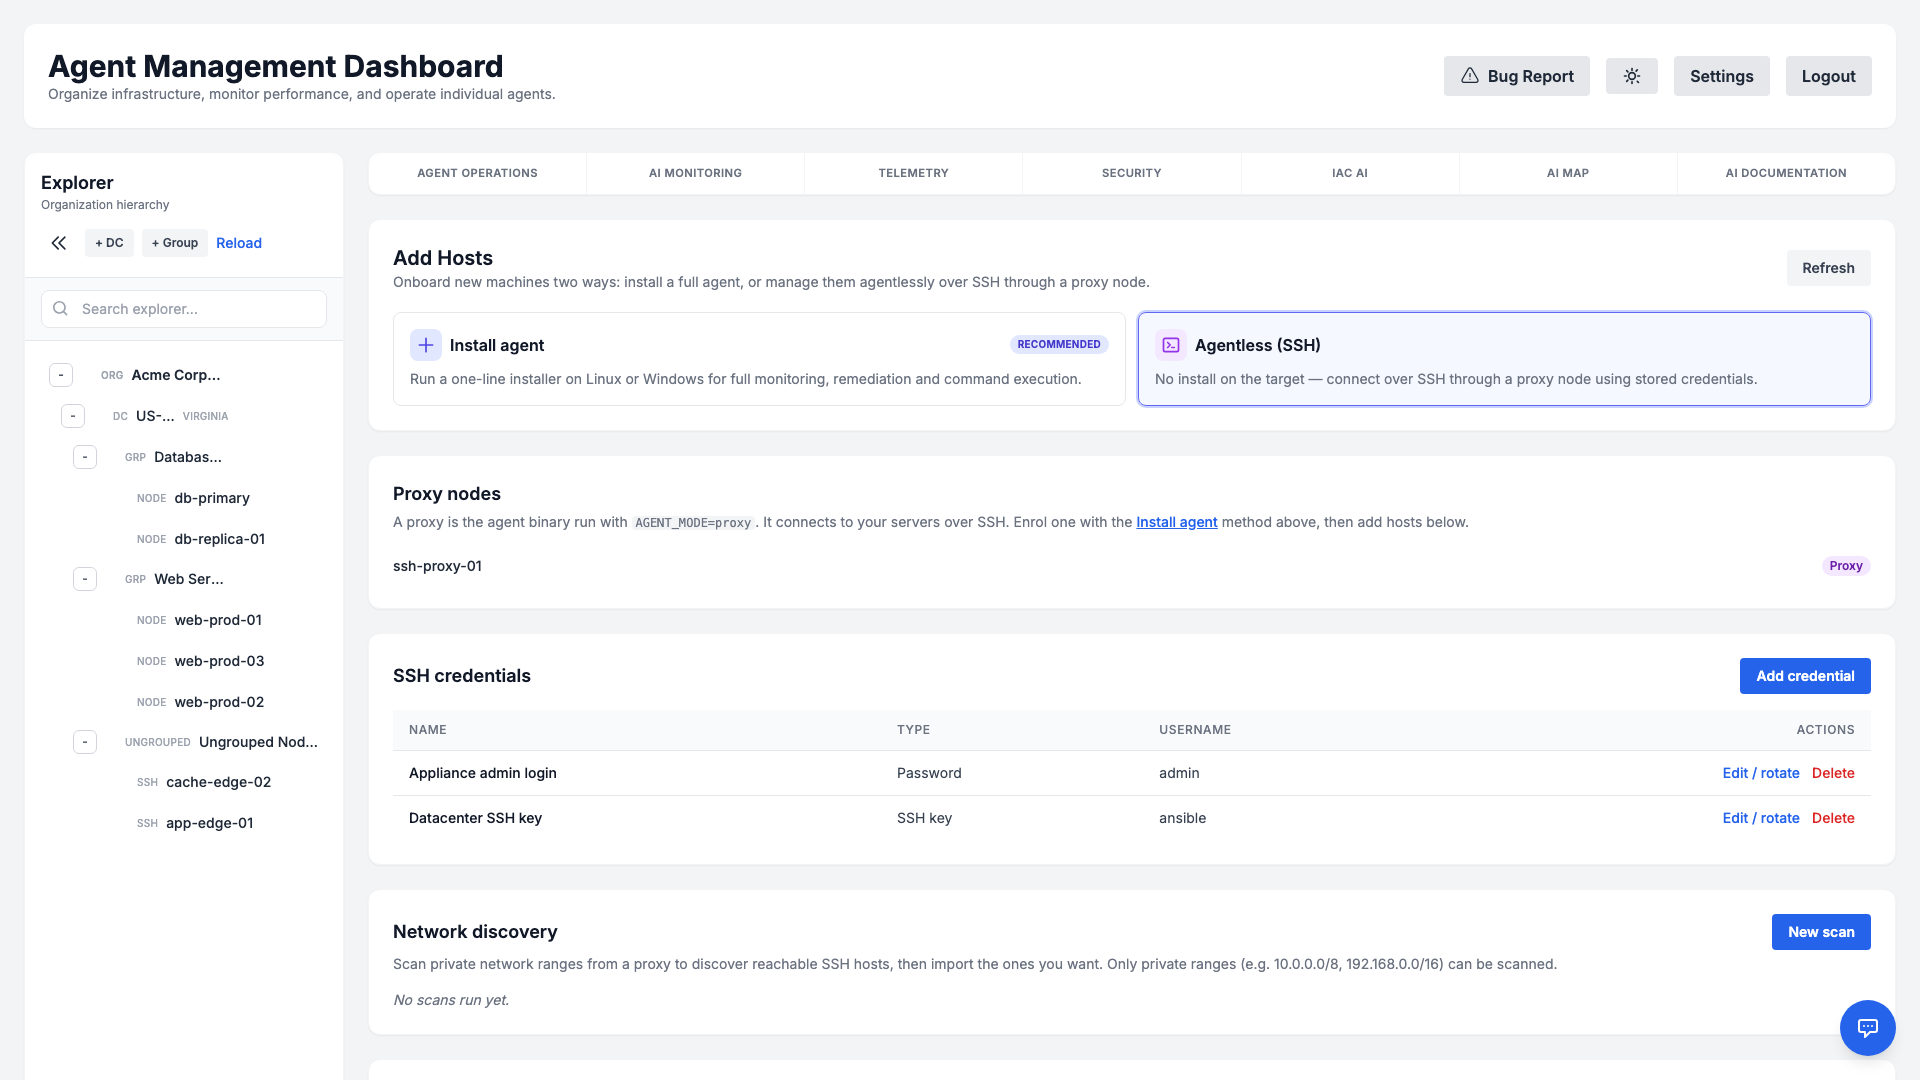
Not every server can run a local agent — appliances, locked-down hosts, or machines you simply prefer to manage over SSH. Agentless mode is the second onboarding method in the Add Hosts view (open it from the Add host button on the Agent Operations page, then choose Agentless (SSH)). It lets you manage those Linux servers through a single proxy node that reaches them over SSH (key or password). Once a host is connected, the platform's existing capabilities — command execution, telemetry & predictive analytics, monitoring checks, File Integrity Monitoring, CVE scanning, SSL discovery, OpenSCAP, Ansible playbooks, and the live interactive terminal — all work over SSH, with no sysAgent software installed on the target. Capabilities that rely on a tool being present on the host (OpenSCAP and Ansible, for example) still need that package there, exactly as they would on a normally-enrolled server.
How it works
A proxy is the ordinary agent binary started in proxy mode inside your network. It keeps a single outbound, encrypted connection to the manager and connects onward to your servers over SSH. Each agentless host is recorded in inventory and routed through its proxy; the manager decrypts the host's SSH credential only at dispatch time and delivers it to the proxy over the already-encrypted manager↔proxy channel — it is never written to disk in plaintext and never returned to the browser.
Commands run on the target host through the proxy, exactly like an installed-agent host — so features that need extra tooling on the host (for example OpenSCAP or Ansible) require that package on the host, just as they would for a normally-enrolled server.
1. Deploy a proxy
Install the agent on a small Linux VM or container inside the network that can reach your servers, and start it in proxy mode:
AGENT_MODE=proxy /opt/sysagent/agentThe node registers itself and appears under Proxy nodes in the Add Hosts → Agentless (SSH) view.
2. Add an SSH credential
In Add Hosts → Agentless (SSH) → SSH credentials → Add credential, store either an SSH private key (with an optional passphrase) or a password, plus the login username. Secrets are encrypted at rest and are write-only — the credential list only ever shows the name, type, and username, never the secret. A credential belongs to one organization and can only be attached to hosts in that same organization. You can later rotate a credential's secret in place from the same screen; every host using it keeps working with the new secret, with no re-assignment.
3. Add hosts
You can register hosts two ways:
- Manually — in Add Hosts → Agentless (SSH) → Agentless hosts → Add SSH host, pick the proxy and credential and enter the host address, port, and username.
- By network discovery — in the Network discovery section, choose a proxy and enter one or more private network ranges (CIDR) and ports. The proxy performs a bounded, read-only TCP scan and returns the reachable SSH hosts; select the ones you want and import them in bulk with a chosen credential. Only private (RFC‑1918 / CGNAT / ULA) ranges can be scanned — public and infrastructure ranges are refused — and the scan is size-bounded so it can never become a network-stress tool.
Security
Agentless management is built defence-first:
- Encrypted credential vault. Keys and passwords are stored encrypted, never logged, and masked in every API response; reads are organization-scoped.
- Host-key pinning (anti-MITM). On first contact the proxy records and pins the host's SSH key fingerprint (trust-on-first-use) and refuses to connect if it later changes. If a host is legitimately reinstalled or rekeyed, an administrator explicitly resets the pinned key (an audited action) so the next connection re-pins the new one — a silently changed key keeps failing until a human intervenes.
- SSRF-safe targeting. Connection and scan targets are validated against a deny-list (loopback, link-local, cloud-metadata, multicast, and similar ranges are refused) before any credential is sent.
- Strict multi-tenant isolation. A host, its proxy, and its credential always share the same organization; a proxy can never be routed to another tenant's host, and every action (add, scan, import, rotate, reset) is recorded in the audit log.
- Least privilege. Managing proxies, credentials, hosts, and scans requires a privileged administrator session.
Relay & Proxy Nodes
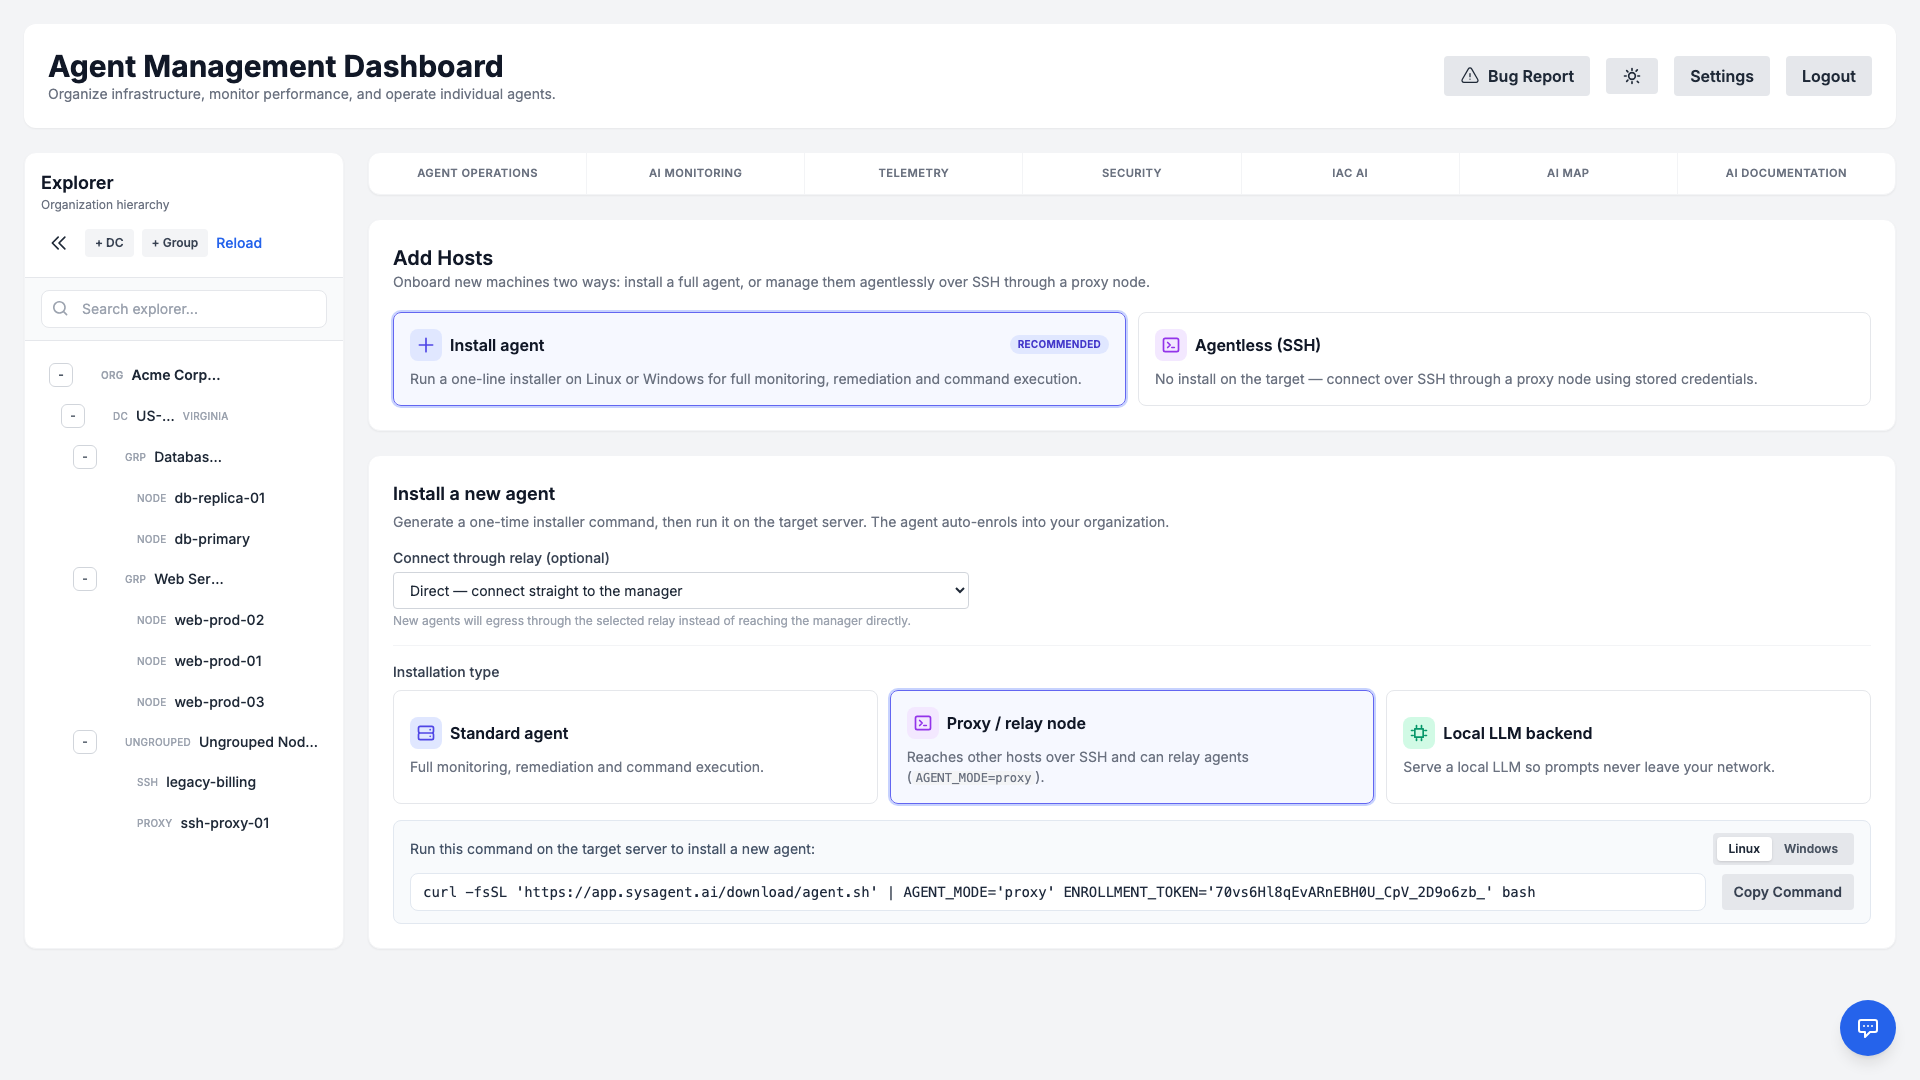
Large or locked-down networks often can't give every server outbound access to the cloud. A relay node solves this: it is the ordinary agent binary started in proxy mode (AGENT_MODE=proxy) that keeps a single outbound connection to the manager and lets the rest of your fleet reach the cloud through it — so only the relay needs egress. The same node also fans out to agentless SSH hosts, making it dual-role.
Install a relay
In Add Hosts → Install agent, choose the Proxy / relay node installation type and run the generated command on a small Linux VM inside your network. The node registers itself and appears under Proxy nodes in the Agentless (SSH) view.
Advertise the relay & enrol through it
Give the relay an advertised URL (the internal address other agents use to reach it) under Agentless (SSH) → Proxy nodes. New agents can then pick it from the Connect through relay selector when you generate their installer command — the command points the new agent at the relay instead of the manager, so it needs no direct internet. Each agent's detail header shows a via relay badge so you can see which relay it egresses through.
Transport modes
- Transparent (L7) proxy (default) — forwards HTTP and WebSocket traffic to the cloud with full observability (per-agent relay attribution and access logging). Producing that visibility means the relay terminates TLS and sees the forwarded traffic, so treat the relay host as trusted infrastructure. What stays end-to-end is authentication: each agent proves itself to the manager with its own session token, so the relay cannot impersonate an agent or the manager. It also holds no command logic, and where command signing is set to enforce, it cannot forge a command either. Set
RELAY_TLS_CERTandRELAY_TLS_KEYto encrypt the agent→relay leg; without them that leg is plain HTTP inside your network. - TLS passthrough (L4) — set
RELAY_MODE=passthroughfor a pure TCP passthrough where the relay sees only ciphertext. This is the strongest anti-cloning posture (no plaintext and no crypto material on customer territory), at the cost of per-agent visibility.
High availability
Give agents a comma-separated list of fallback entry points with MANAGER_API_FALLBACK_URLS. If the active relay or manager becomes unreachable, an agent automatically rotates to the next configured URL instead of being stranded — a fallback that would downgrade an https connection to plaintext is dropped, so failover never leaks the session token.
Dashboard Overview
The main dashboard provides a birds-eye view of your infrastructure. You can see real-time metrics for CPU, Memory, Disk I/O, and network activity across your entire fleet.
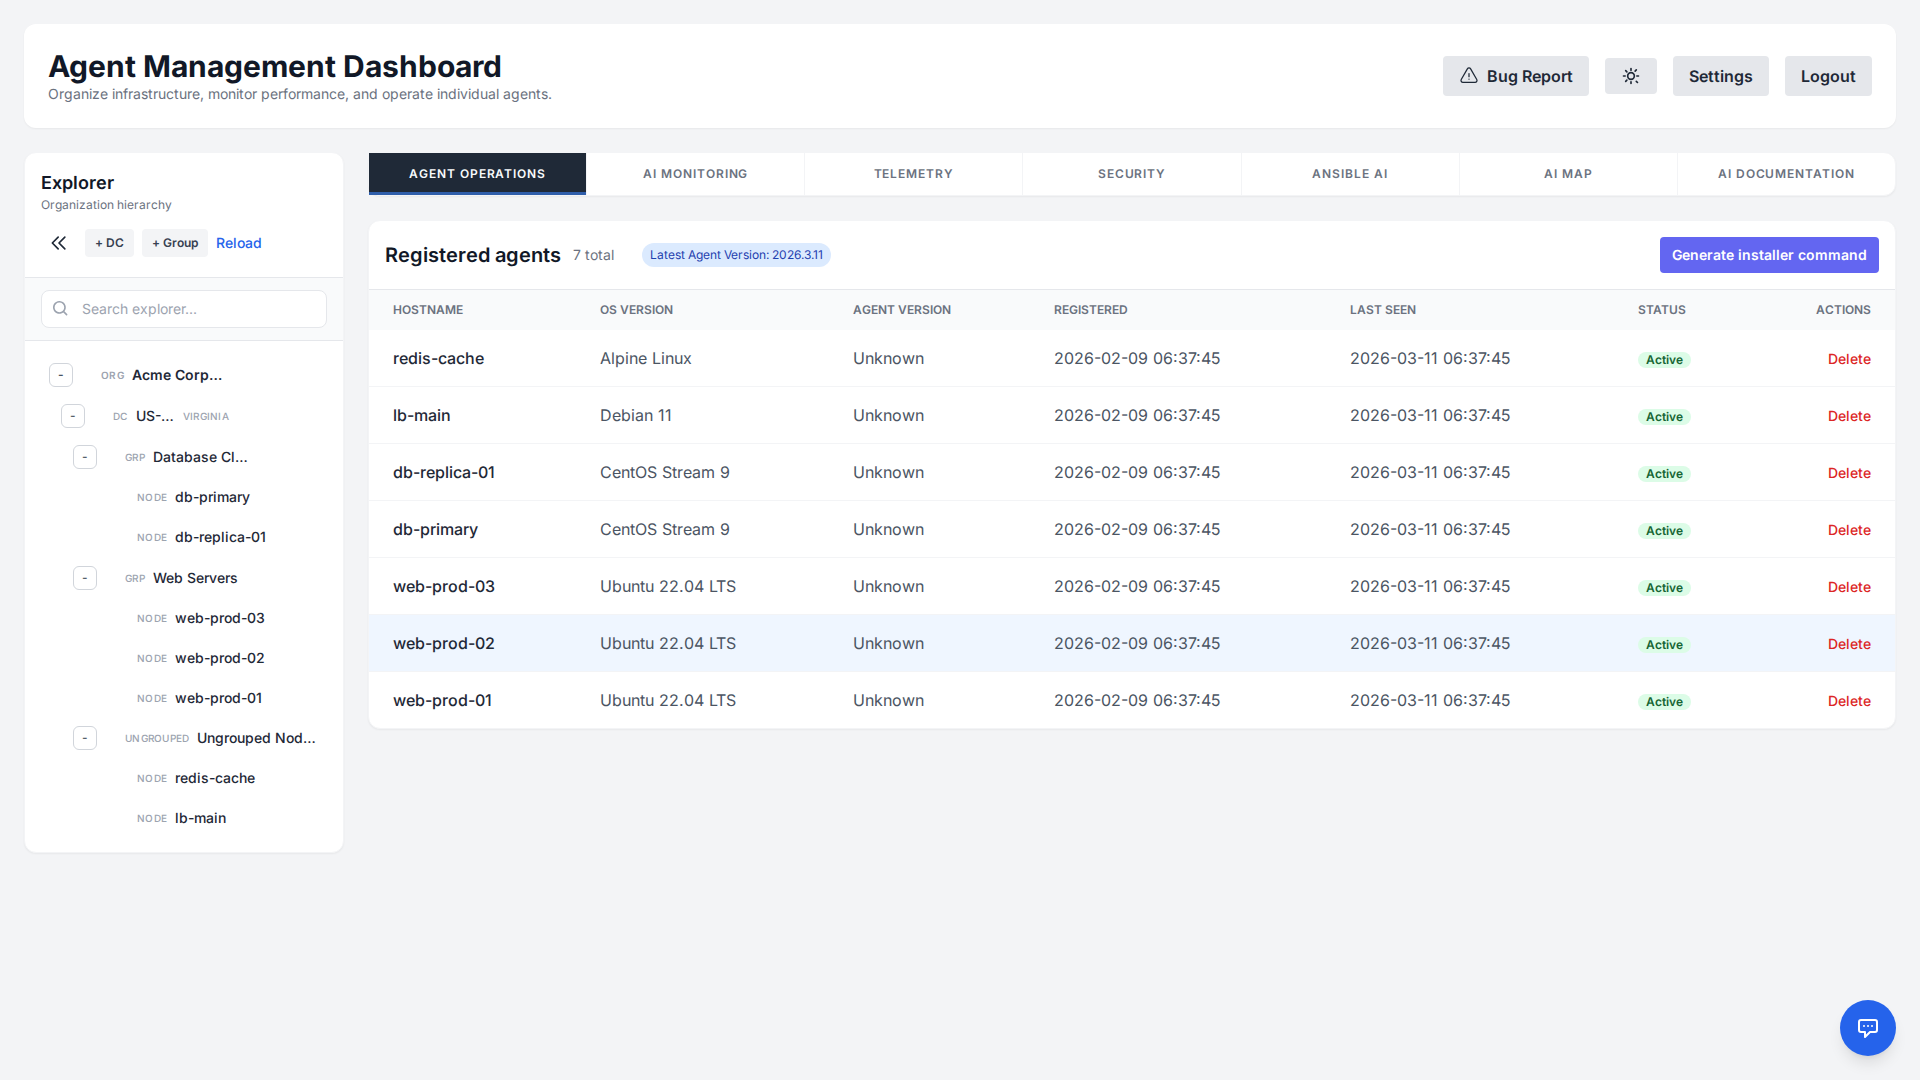
The Explorer panel on the left allows you to organize your fleet. You can create Datacenters and Machine Groups to structure your servers logically. To interact with or view details for any specific server or group, simply click on it in the Explorer tree.
Host Tags
Datacenters and machine groups describe where a host lives: it belongs to exactly one datacenter, and normally to a single machine group. Tags describe what a host is — role:database, pci, staging — and a host can carry as many as you need. That flat second dimension is what lets you address “every PCI database host” without reshaping the hierarchy.
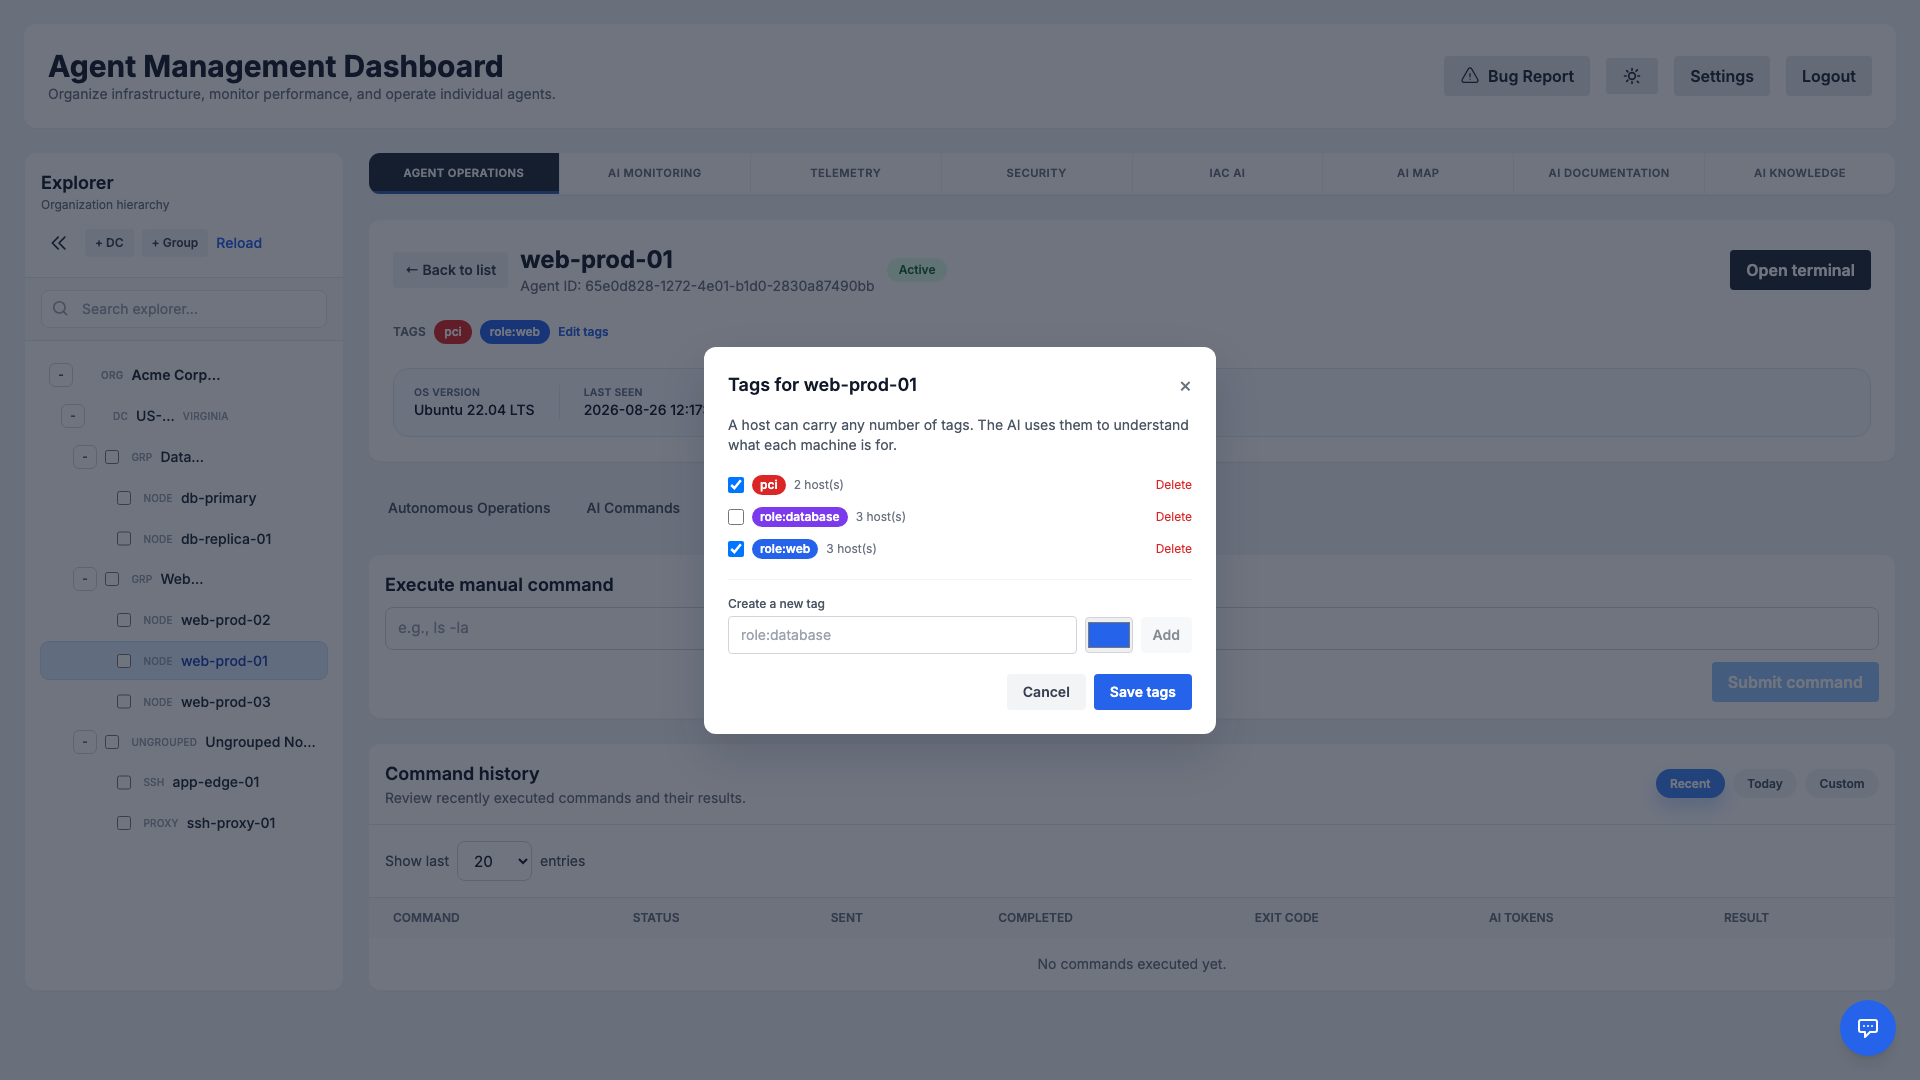
Tagging a host
Open a server from the Explorer and use Edit tags under its header. The dialog lists every tag in your organization with the number of hosts carrying it; tick the ones that apply, or type a name and pick a colour to create a new one on the spot. Saving replaces the host's tag set, so unticking a tag removes it.
Tags are scoped to your organization and unique by name within it. A name must start with a letter or a digit, and may then also contain spaces and . _ - : / — the colon is what makes the key:value style read well.
What tags are used for
- AI orientation: tags are part of the inventory the AI knowledge engine collects, so once a knowledge file has been generated the assistant knows a host is a database or is in PCI scope without being told each time.
- Knowledge scope: an AI knowledge file can be scoped to a set of tags rather than to a datacenter or group.
Autonomous Operations
Autonomous Operations let the AI plan and execute multi-step tasks on a server with full transparency and human oversight. Describe a goal in plain English — for example, "Analyze disk usage and clean up old logs" — and the agent breaks it into discrete, ordered steps.
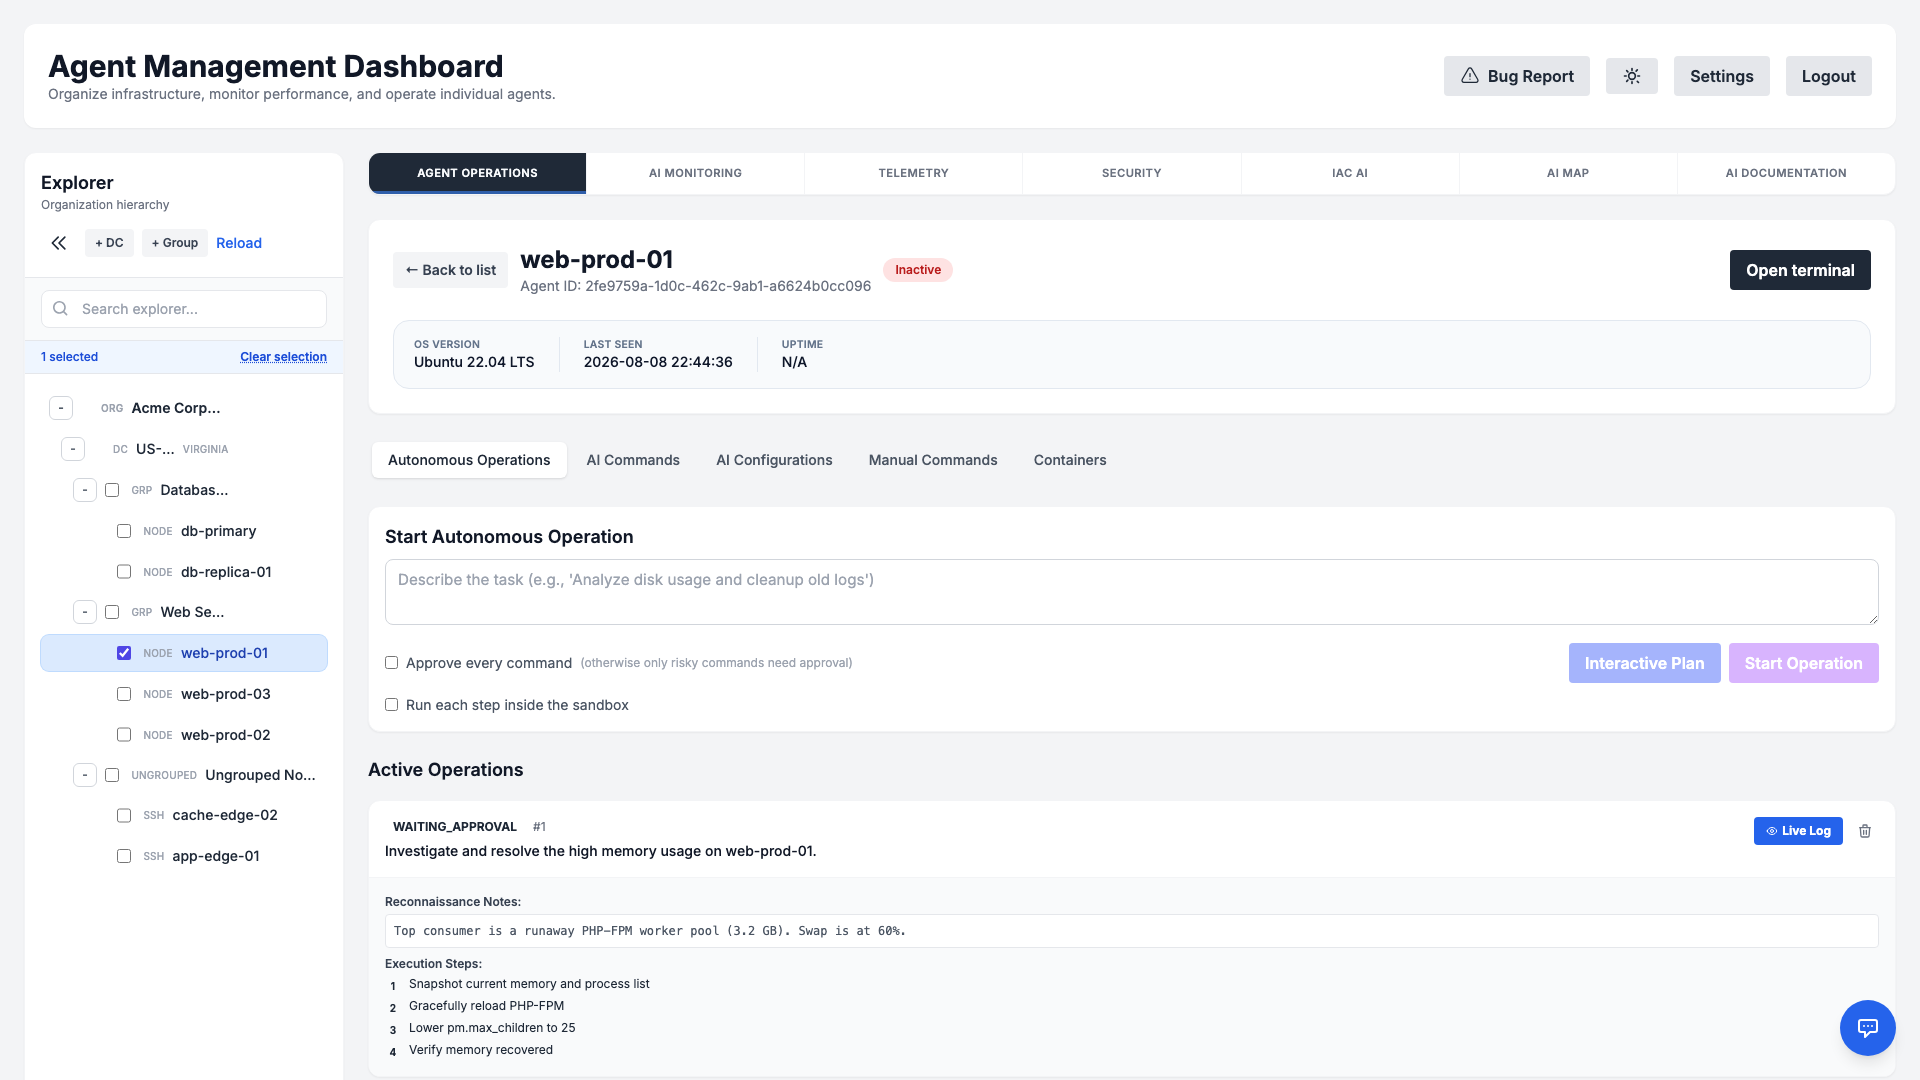
How it works
- Step-by-step plan: Each operation is decomposed into individual steps, each with its own command, status, and output.
- Approval gates: Operations can pause in a
WAITING_APPROVALstate so an administrator reviews the plan before any change is applied. - Live progress: Watch steps move through
PENDING,RUNNING, andCOMPLETEDstates in real time. - Safe by design: Operations respect maintenance windows and RBAC permissions, and every action is recorded in the audit log.
Interactive Plan vs. Start Operation
After you describe a task, two buttons let you choose how much you stay in the loop:
- Interactive Plan — Opens a conversational planning session with the AI before anything runs on the server. The agent proposes a plan, and you can chat back and forth — refine the goal, add constraints, ask questions, and adjust steps — until the plan is exactly what you want. Nothing is executed until you explicitly confirm the finalized plan. Choose this for complex, unfamiliar, or higher-risk tasks where you want to shape the approach first.
- Start Operation — Launches the operation immediately. The AI analyzes the goal, generates the full step-by-step plan, and begins executing it (still honoring any approval gates, maintenance windows, and RBAC checks). Choose this for routine or well-understood tasks where you trust the agent to plan and proceed on its own.
In short: Interactive Plan is a "review and refine together first" workflow, while Start Operation is a "plan and go" workflow. Both produce the same kind of transparent, auditable, step-by-step operation — they differ only in how much you collaborate on the plan up front.
AI Command Execution
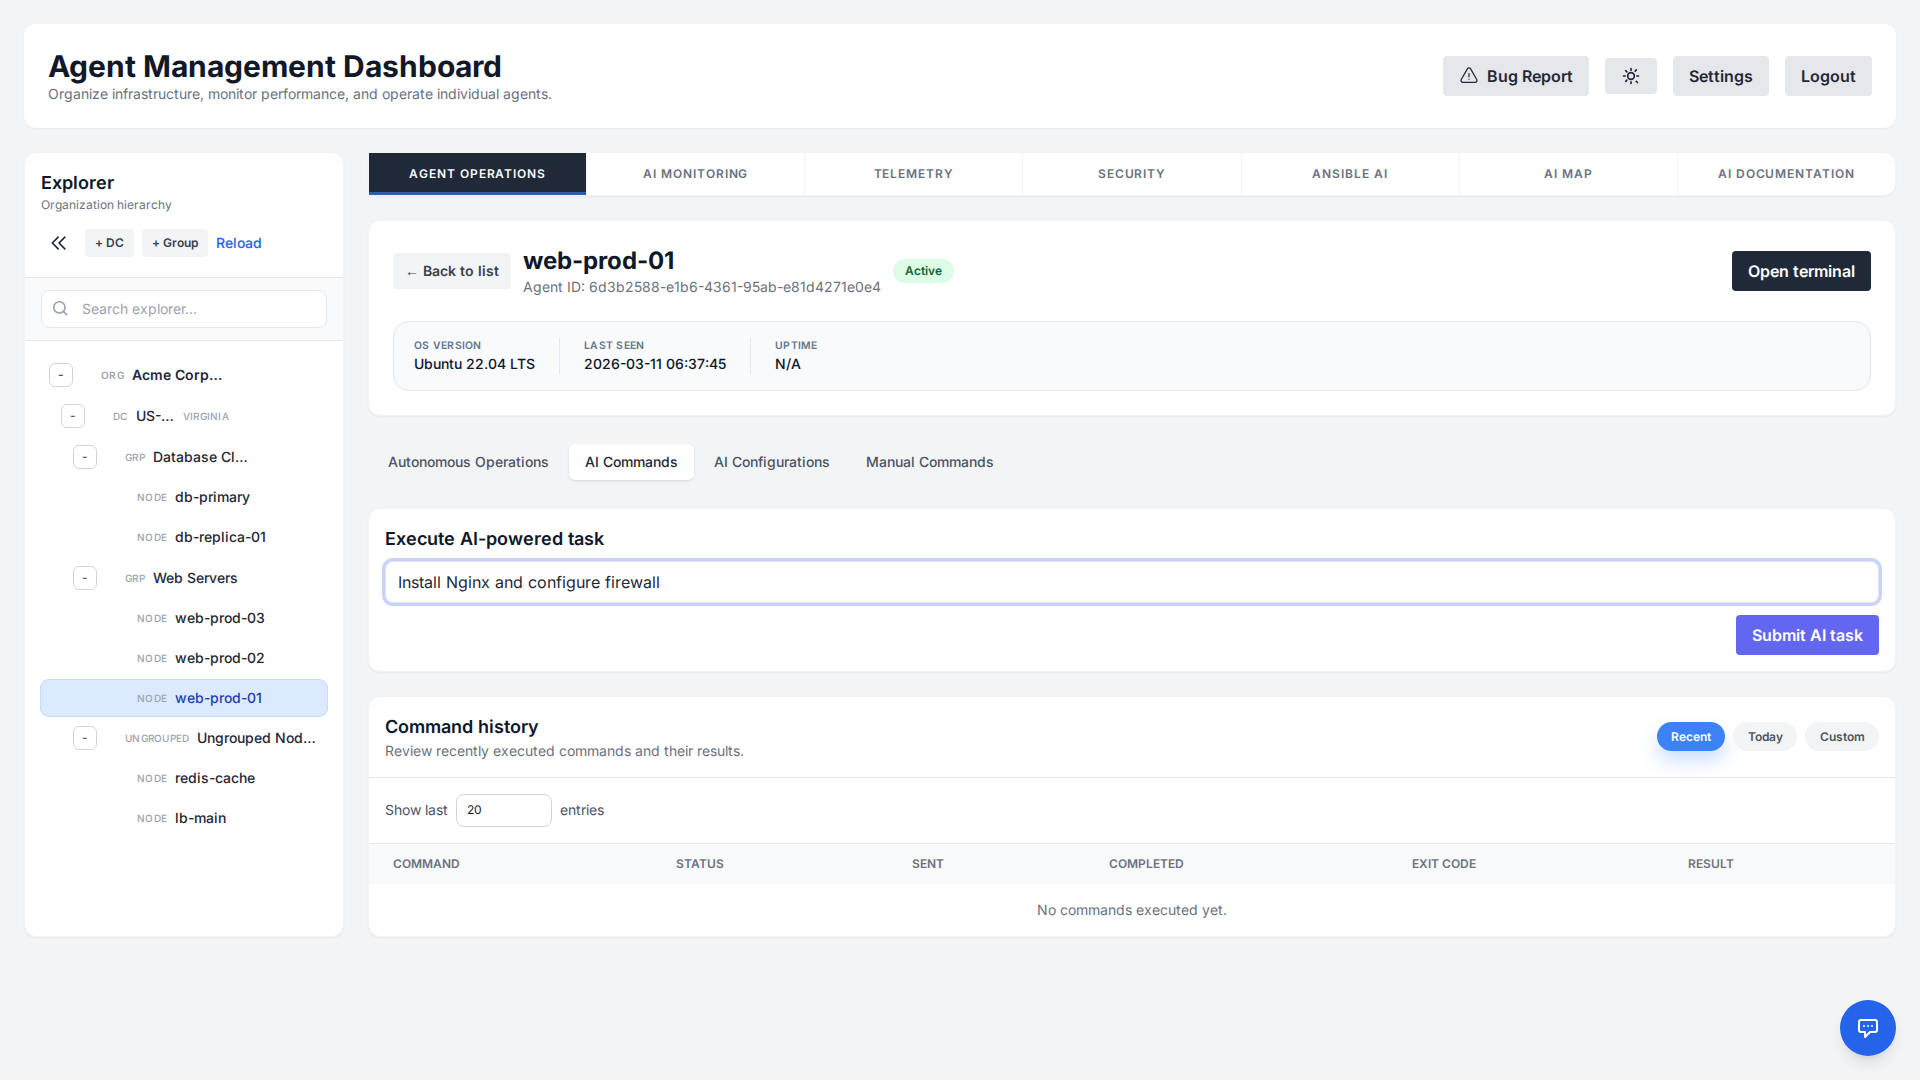
Interact with your servers using natural language. The "Execute" tab provides a chat interface where you can ask the agent to perform tasks. The AI automatically detects the target OS and generates Bash or PowerShell commands accordingly.
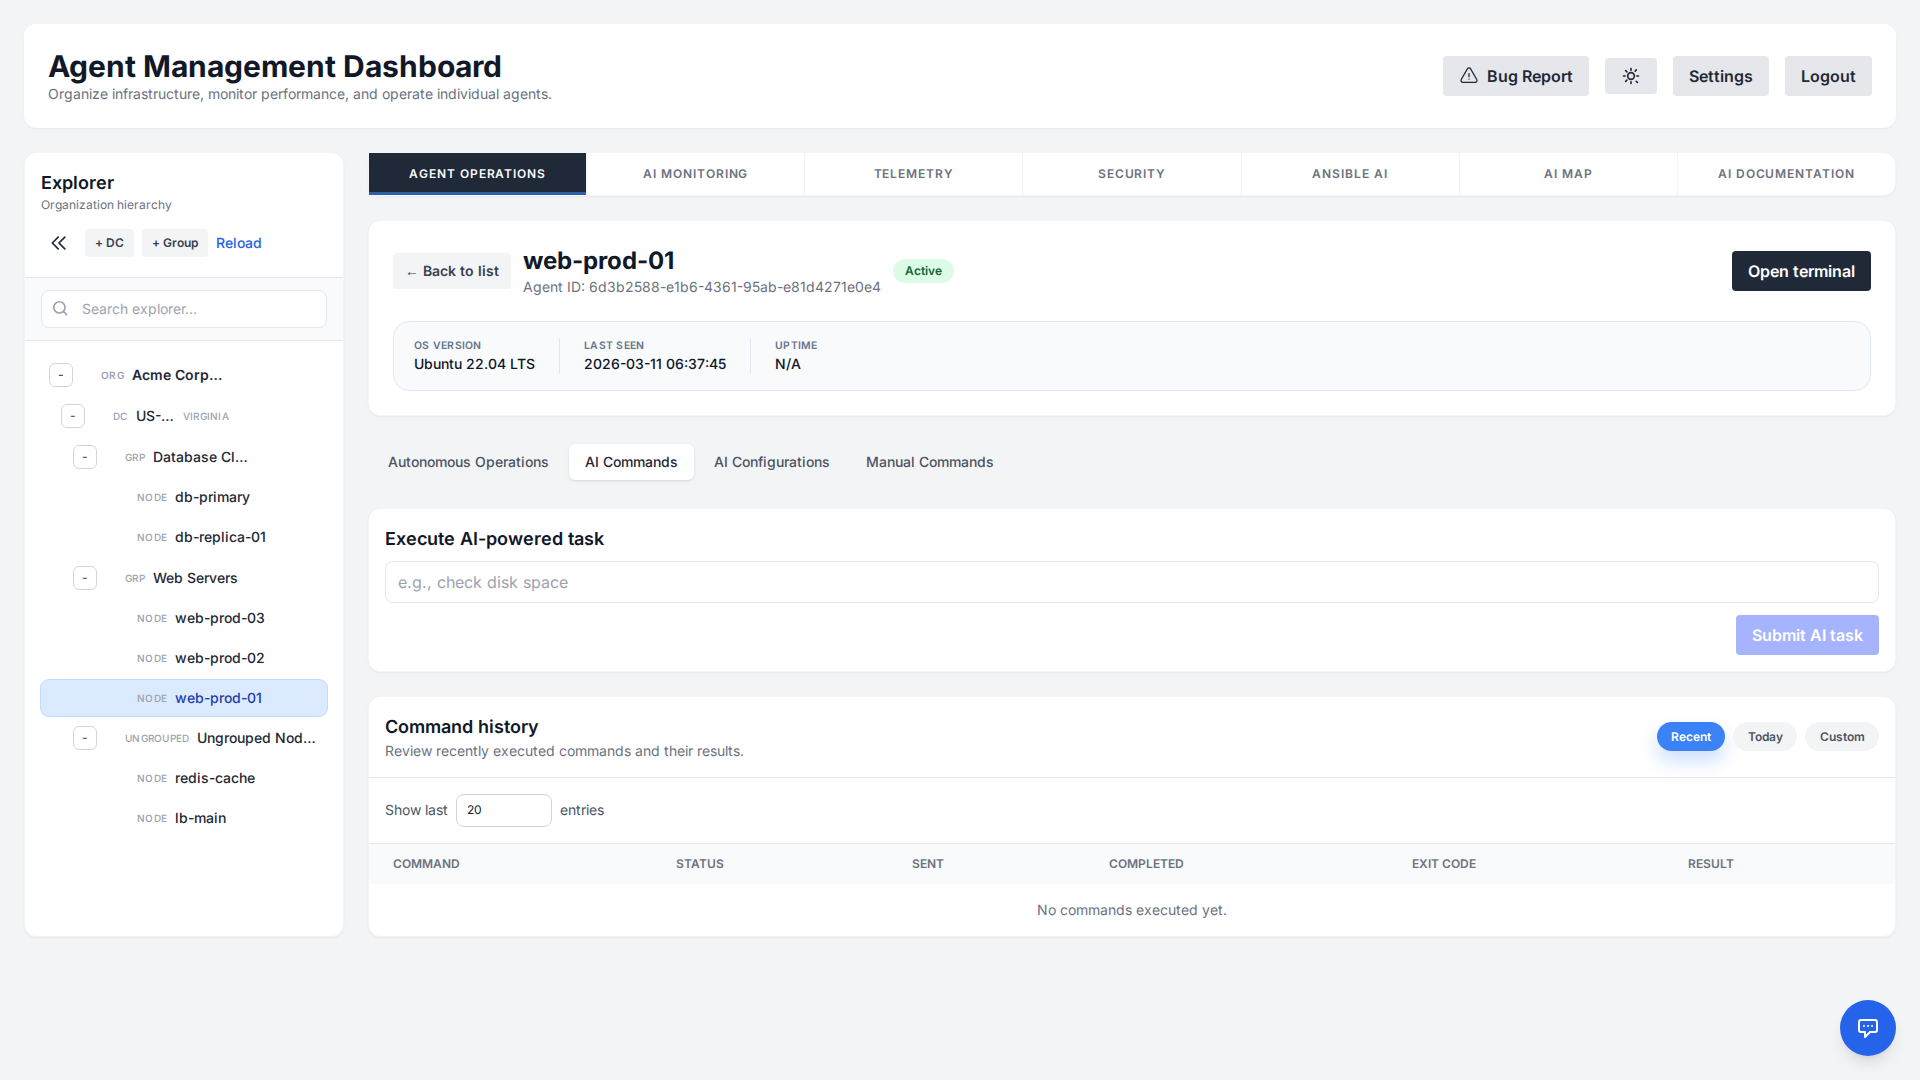
Example prompts:
- "Find the process consuming the most memory and kill it."
- "Check if the IIS/Nginx service is running and restart it if not."
- "List all large files in C:\Logs or /var/log."
Asking about measurements instead of running commands
Some questions are about numbers the platform already collects — “which host had the highest CPU last week?”, “show me memory on db-01 over the last 24 hours”, “which servers are running out of disk?”. Running a shell command to answer those would only report this instant and would miss the spike you are asking about, so the AI reads the stored history instead.
- CPU and memory trends normally involve no generated SQL: for these the model picks from a fixed vocabulary — a scope, a metric, an aggregation, a time window, a bucket size — each validated against an allow-list, and the server builds the query. On this path the model does not name a table or write a line of SQL.
- Other questions do use generated SQL, sandboxed: a question the parameter vocabulary cannot express (“how many agents are offline?”, “which hosts have critical CVEs?”), or a trend question whose parameters fail validation, falls back to model-written SQL. Every such query is stripped of comments and rejected unless it is a single read-only
SELECT. For an organization-scoped user it must additionally stay within a documented set of tables, and is refused if it names a system catalog or a schema-qualified table. - Scoped like everything else: for an organization-scoped user the query does not run against the real tables at all. Temporary views filtered to that user's organizations shadow every readable table for the duration of the query, so another tenant's rows are unreachable even if the generated SQL omits a
WHEREclause entirely. - Honest about gaps: If a host reported no data for the window, the answer says so rather than returning a confident zero.
Open Terminal
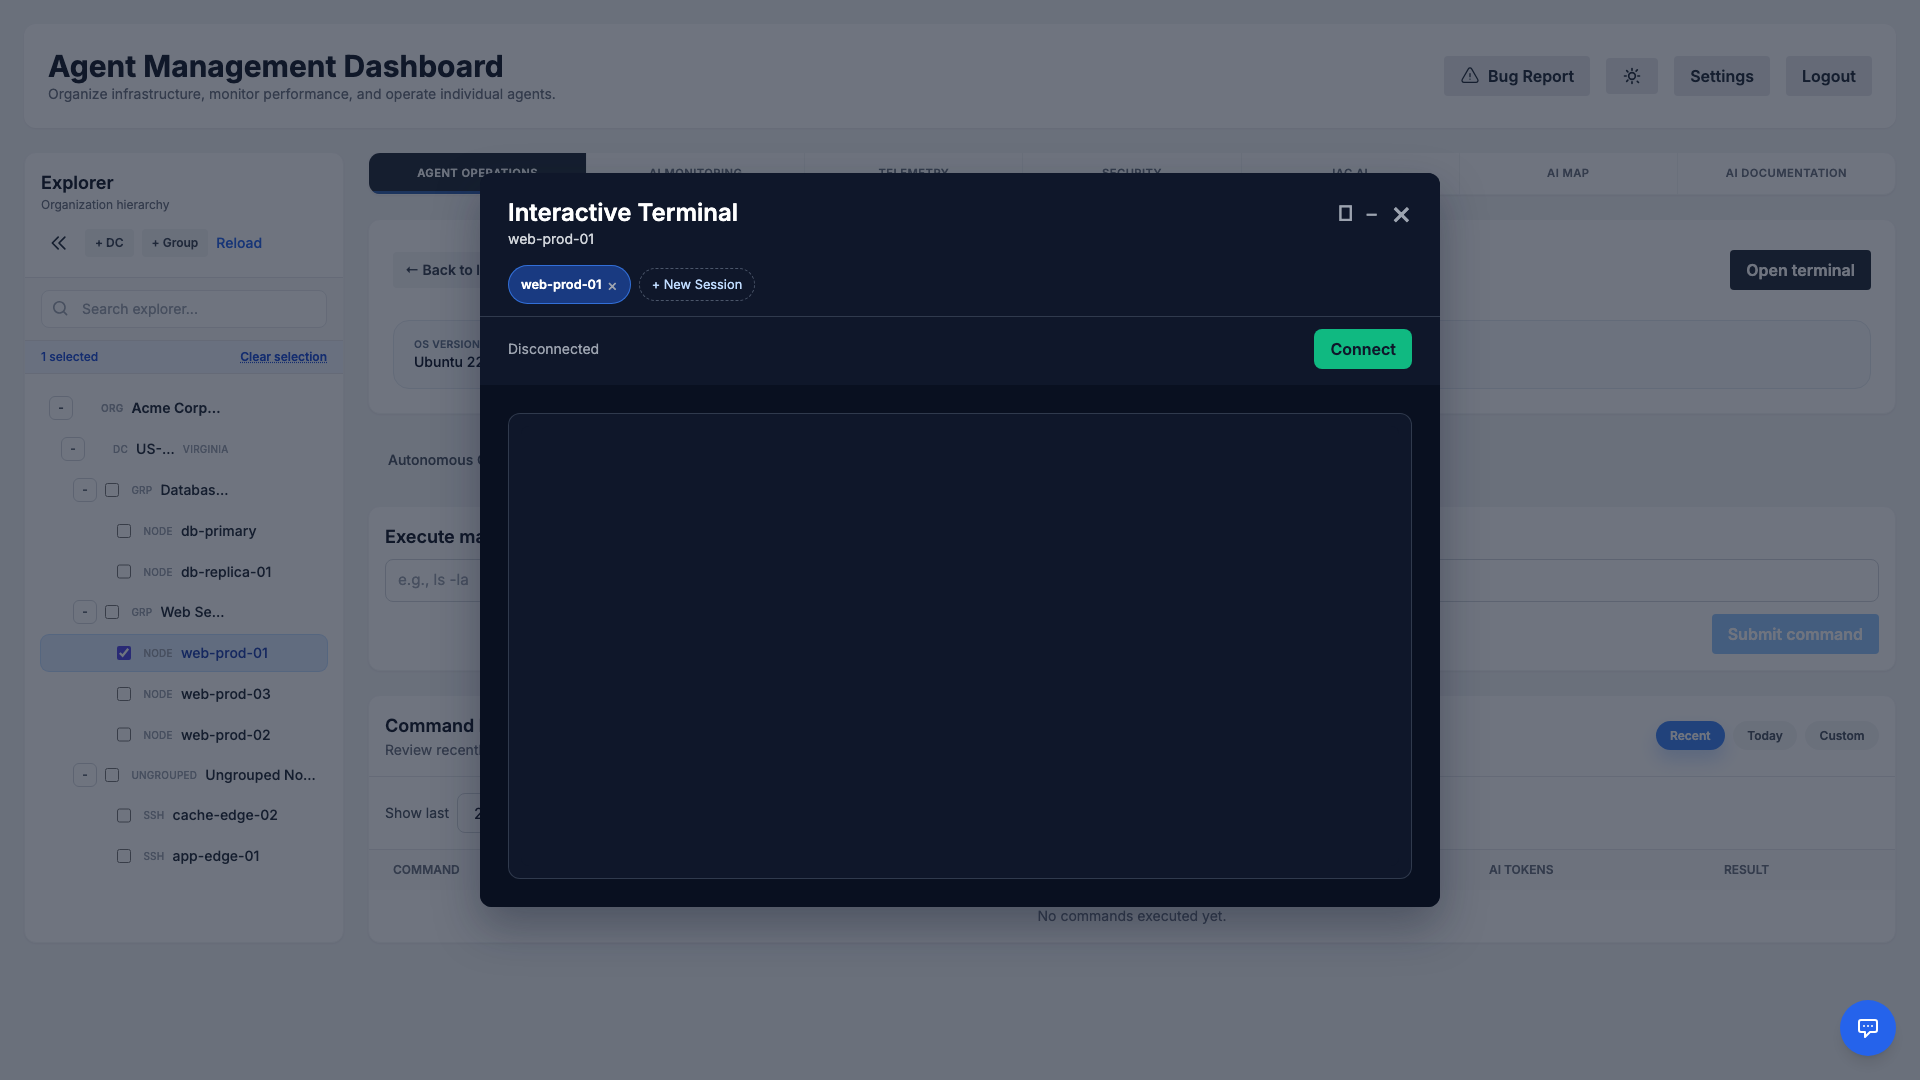
For direct, low-level access, use the Open Terminal feature. This opens a fully interactive session to your server directly in the browser, functioning equivalently to a standard SSH or PowerShell Remoting connection.
Advanced AI Planning
For complex tasks, the AI doesn't just execute commands blindly. It enters a Planning Mode to create a structured execution strategy.
Key Features
- Ordered execution: The commands of a plan run in the order the AI produced them, one after the next, so a plan can rely on
install → configure → restartholding. Separate tasks you submit are independent and may be in flight at the same time; the steps within one plan are never parallelised. - Stop on Failure: If a step exits non-zero the remaining steps are skipped rather than run against a half-finished change (
stop_on_failure, which defaults to on when the AI does not set it itself). Turn it off and the plan runs to the end regardless. - Clarifying questions: Asking before assuming belongs to Autonomous Operations, where an operation can pause in
waiting_user_inputfor an answer. A task submitted here is planned and executed in one pass.
AI Configurations
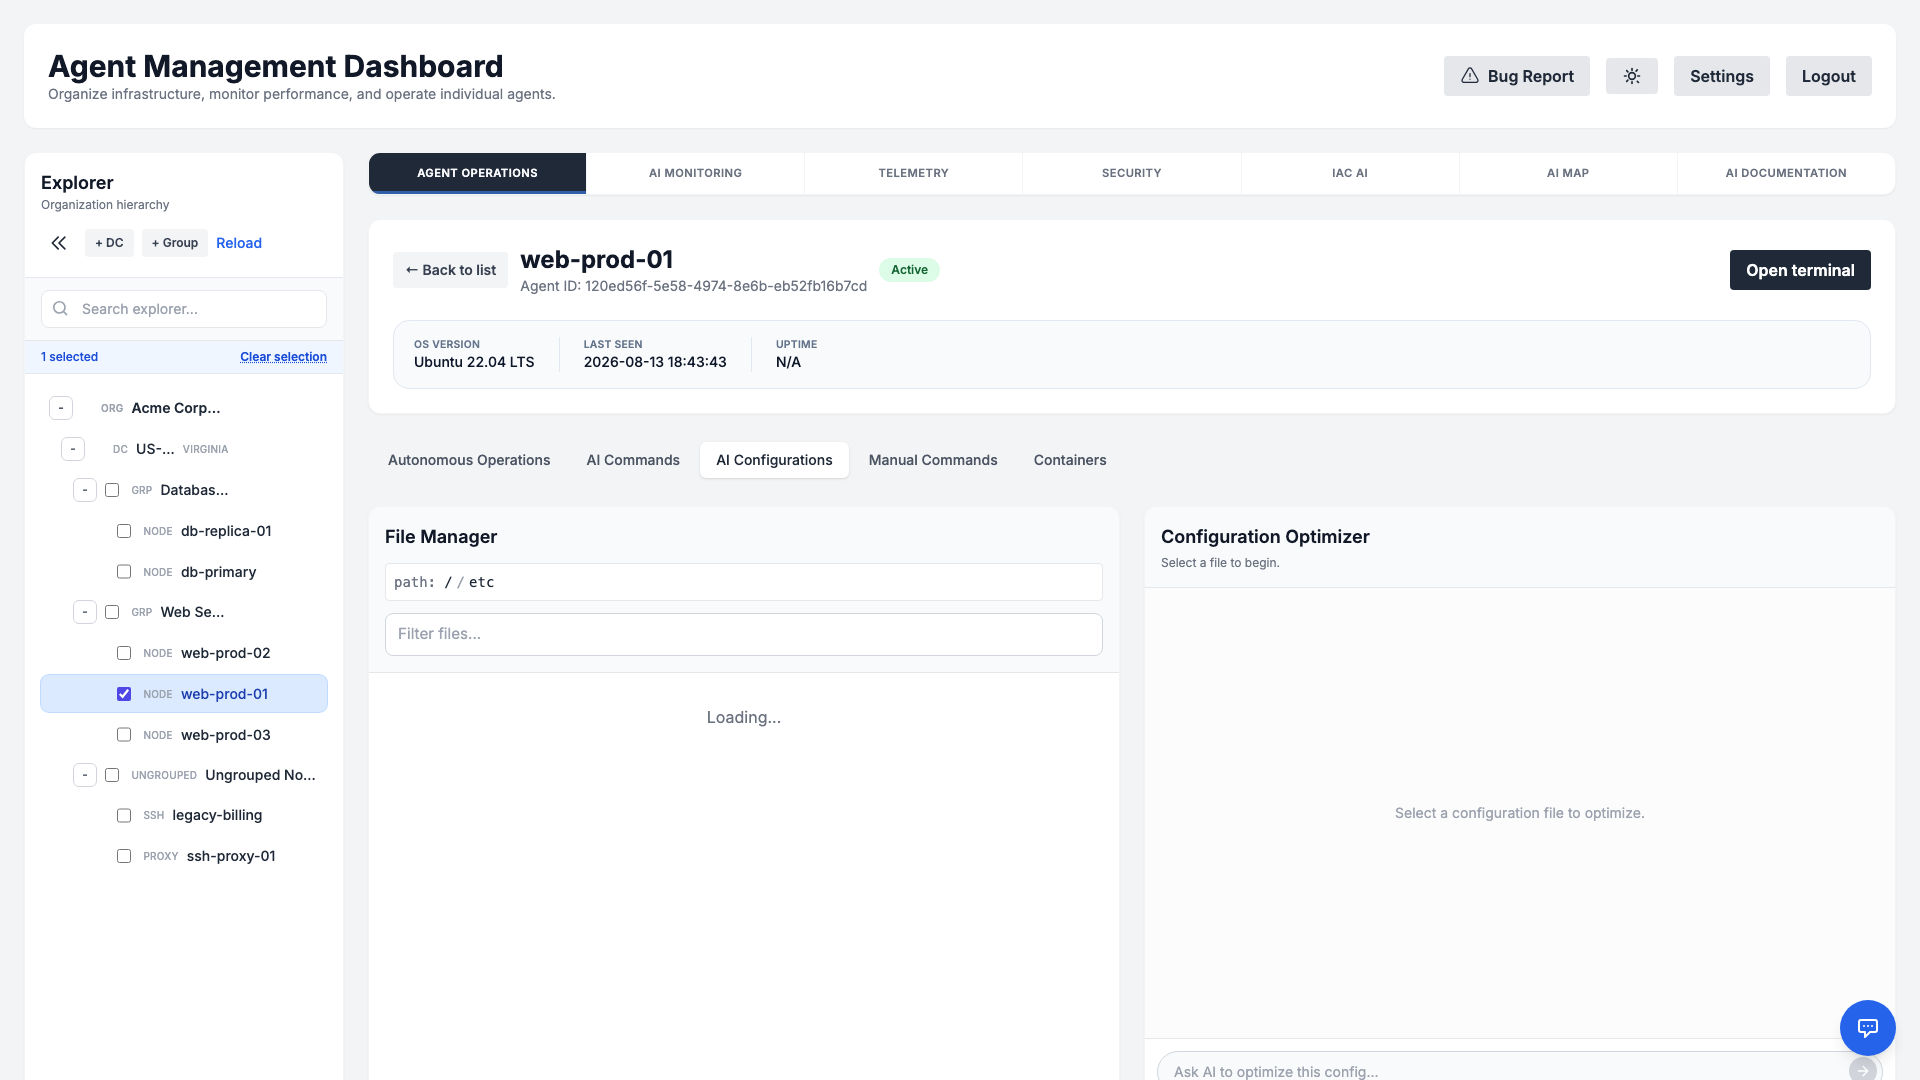
The AI Configurations tab pairs a remote File Manager with an AI-powered Configuration Optimizer, so you can review and improve configuration files on any agent without leaving the dashboard. Browse the agent's filesystem, open a config file (for example nginx.conf, sshd_config, or my.cnf), and the AI reads its contents and helps you analyze, harden, or tune it.
How it works
- Browse & select: Use the breadcrumb path and filter box in the File Manager to navigate the agent's directories and pick the configuration file you want to work on.
- Ask the AI: Describe what you need in plain English — "review this for security best practices", "enable gzip compression", or "explain what this setting does". The optimizer responds in a chat thread with analysis and concrete suggestions.
- Review & apply: When the AI proposes a change, it surfaces a Review & Apply Changes action so you can inspect the exact diff before anything is written. No edit is applied to the file until you approve it.
- Safe & audited: Changes respect RBAC permissions and are captured in the audit log, so configuration edits remain accountable and reversible.
Manual Commands & Terminal
When you prefer direct control, the Manual Commands tab lets you run raw Bash or PowerShell commands against a selected agent without involving the AI. It is ideal for quick, ad-hoc checks and for operators who already know exactly what they want to run.
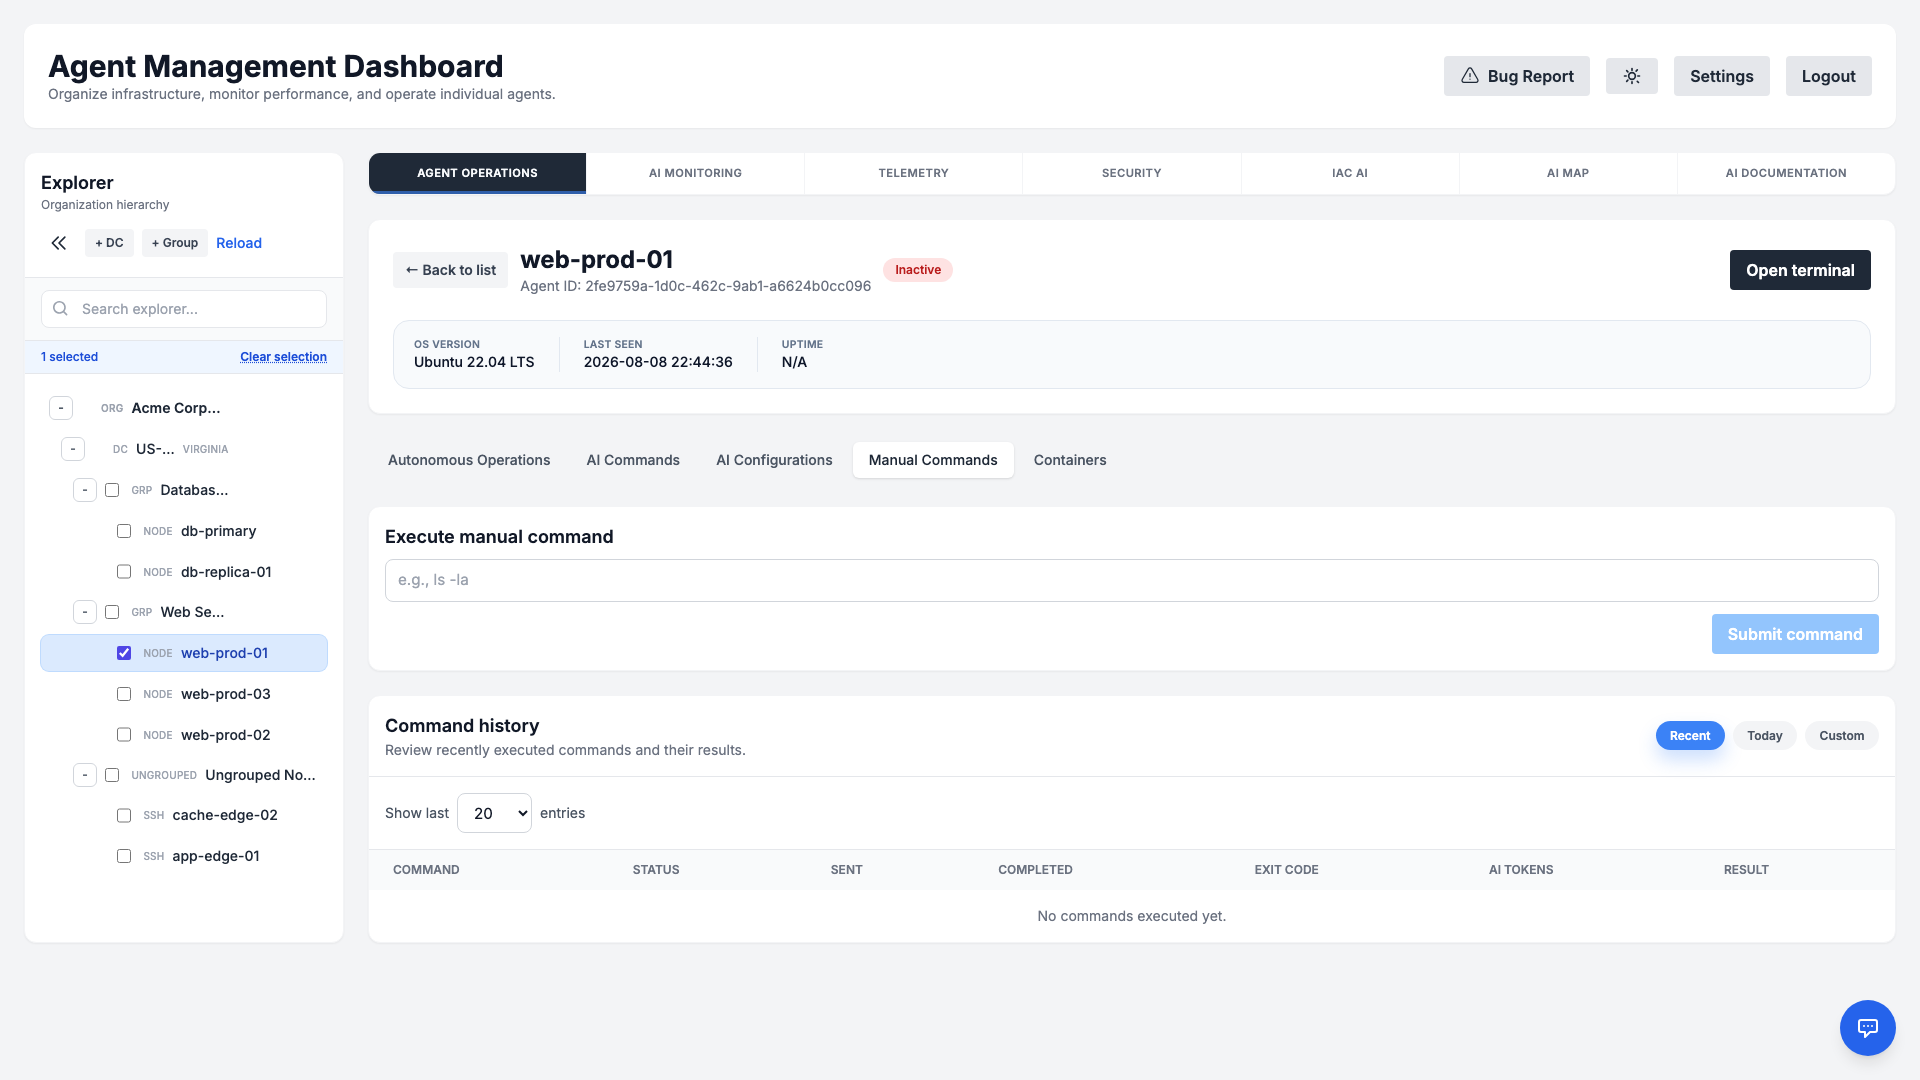
For a fully interactive session, use the Open Terminal feature to get a live, browser-based shell equivalent to SSH (Linux) or PowerShell Remoting (Windows). Know what each path records before you choose one. A manual command is written to the command history and to the audit log as its own entry, with the command text. An AI task is audited once as a task, and each command it generated is written to the command history. An interactive terminal records neither: the audit log captures who opened a session against which host and when it closed, but the keystrokes inside are streamed straight to the shell, so they are never stored, never checked against the destructive-command guard, and never covered by command signing. Where you need a per-command record — or those controls — use Manual Commands rather than the terminal.
Container & Kubernetes Inventory
For hosts running Docker or Kubernetes, a dedicated Containers tab appears in the agent detail view. The agent periodically discovers running containers, local images, and cluster resources, giving you an at-a-glance inventory without leaving the dashboard.
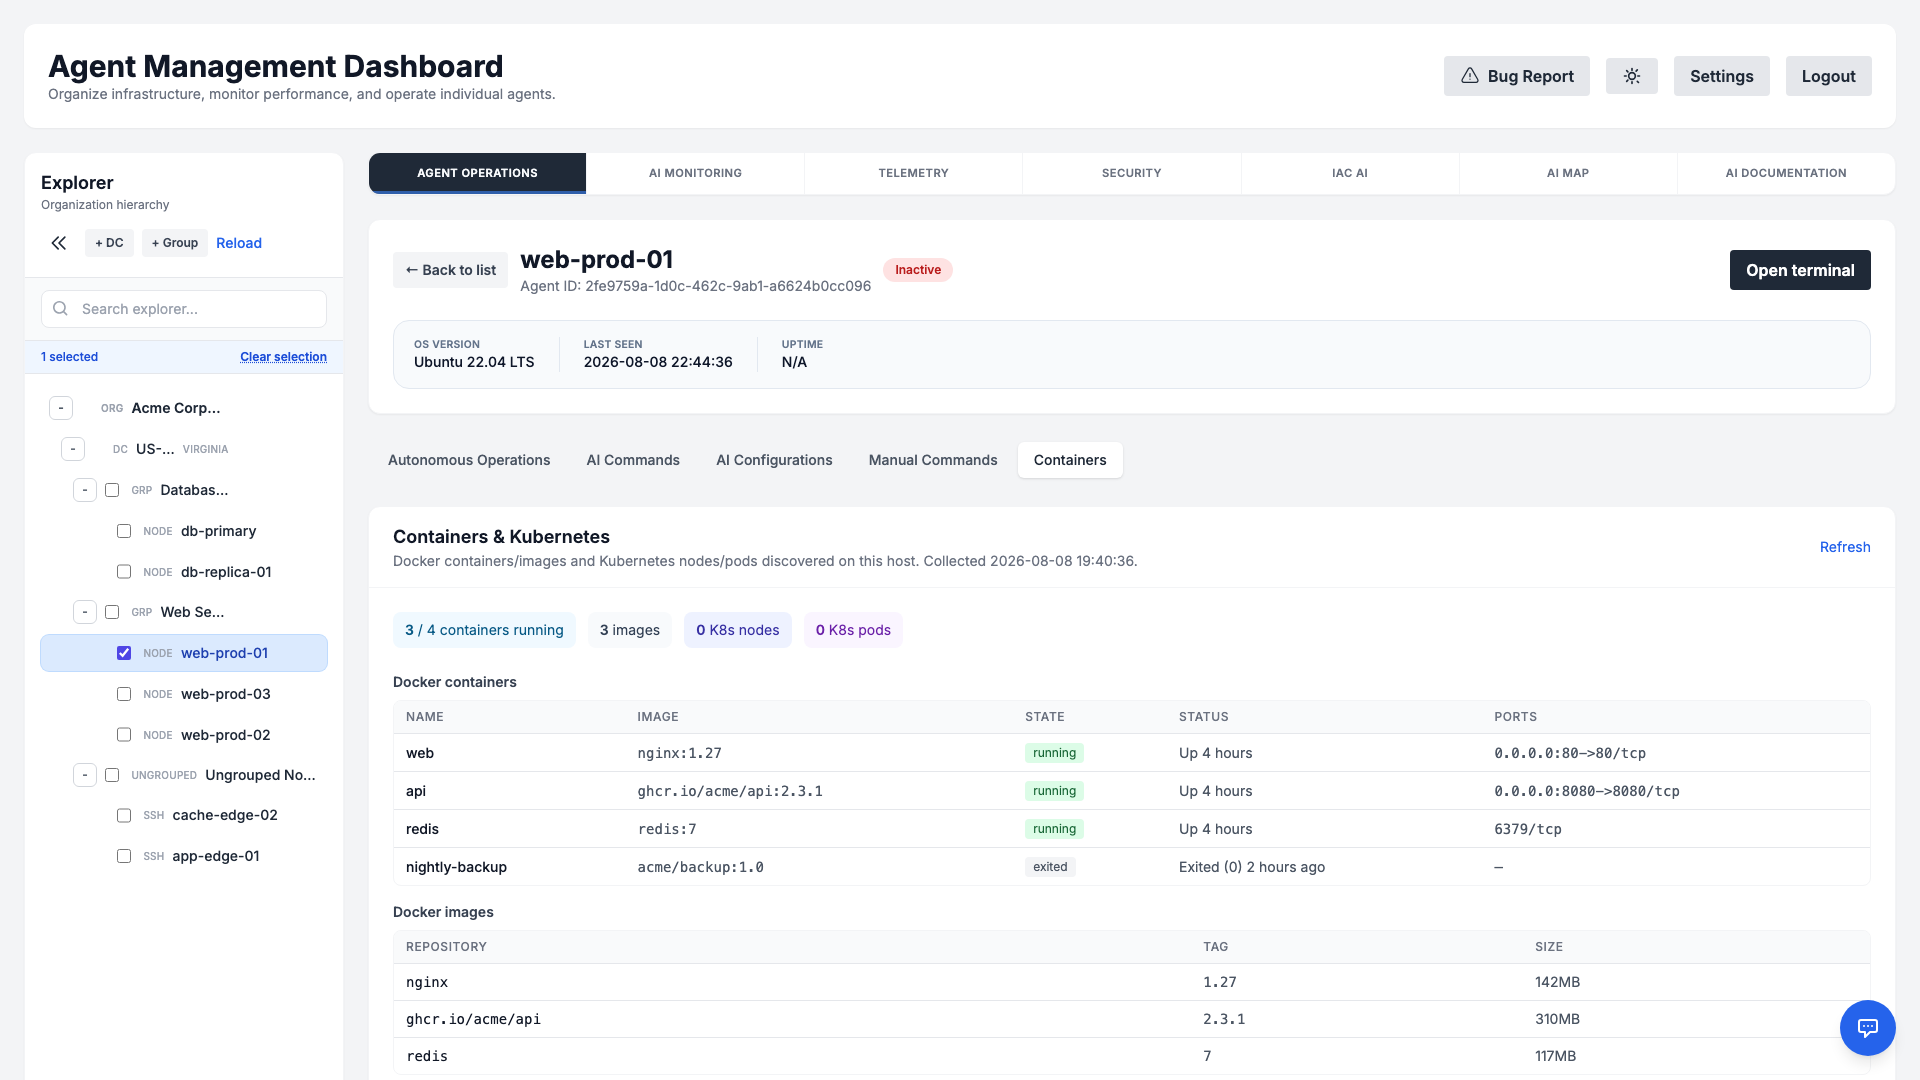
- Docker containers: Name, image, state (running/exited), status, and published ports for every container on the host.
- Docker images: The local image cache with repository, tag, and size.
- Kubernetes: On cluster hosts, view node readiness and versions alongside pod phase and readiness across namespaces.
- Context-aware: The tab appears only for hosts that actually report container or cluster data, and refreshes on demand.
Monitoring Checks
Create custom monitoring scripts without writing code. Describe what you want to check, and the AI will generate the appropriate Bash, Python, or PowerShell script for you based on the agent's OS.
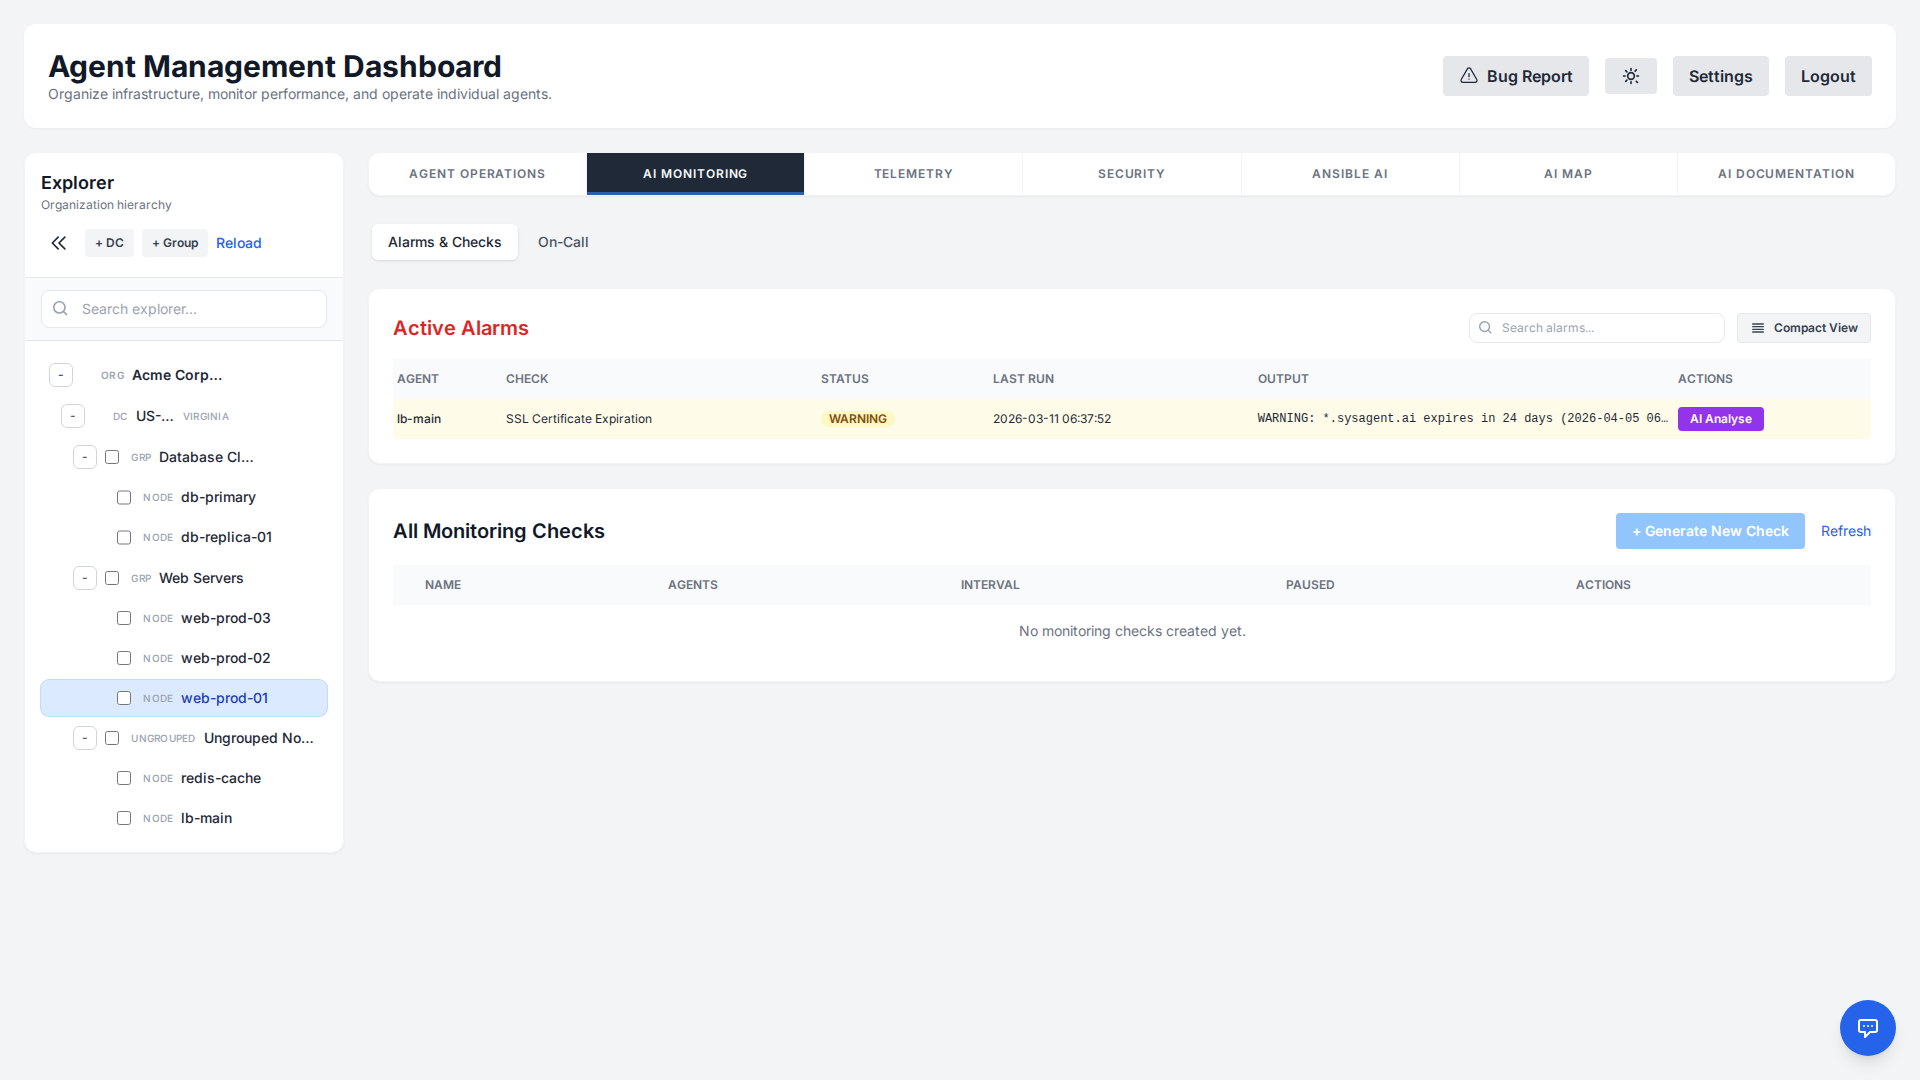
AI Analyse for Alarms
When a monitoring check triggers an alarm (Warning or Critical), you can use the AI Analyse feature. The AI will examine the check's output and system context to diagnose the root cause and suggest immediate remediation steps.
On-Call & Escalation
Make sure the right person is notified when something breaks. The On-Call module lets you organize engineers into Departments, build rotating On-Call Schedules, and define Escalation Rules that page the next responder if an alarm is not acknowledged in time.
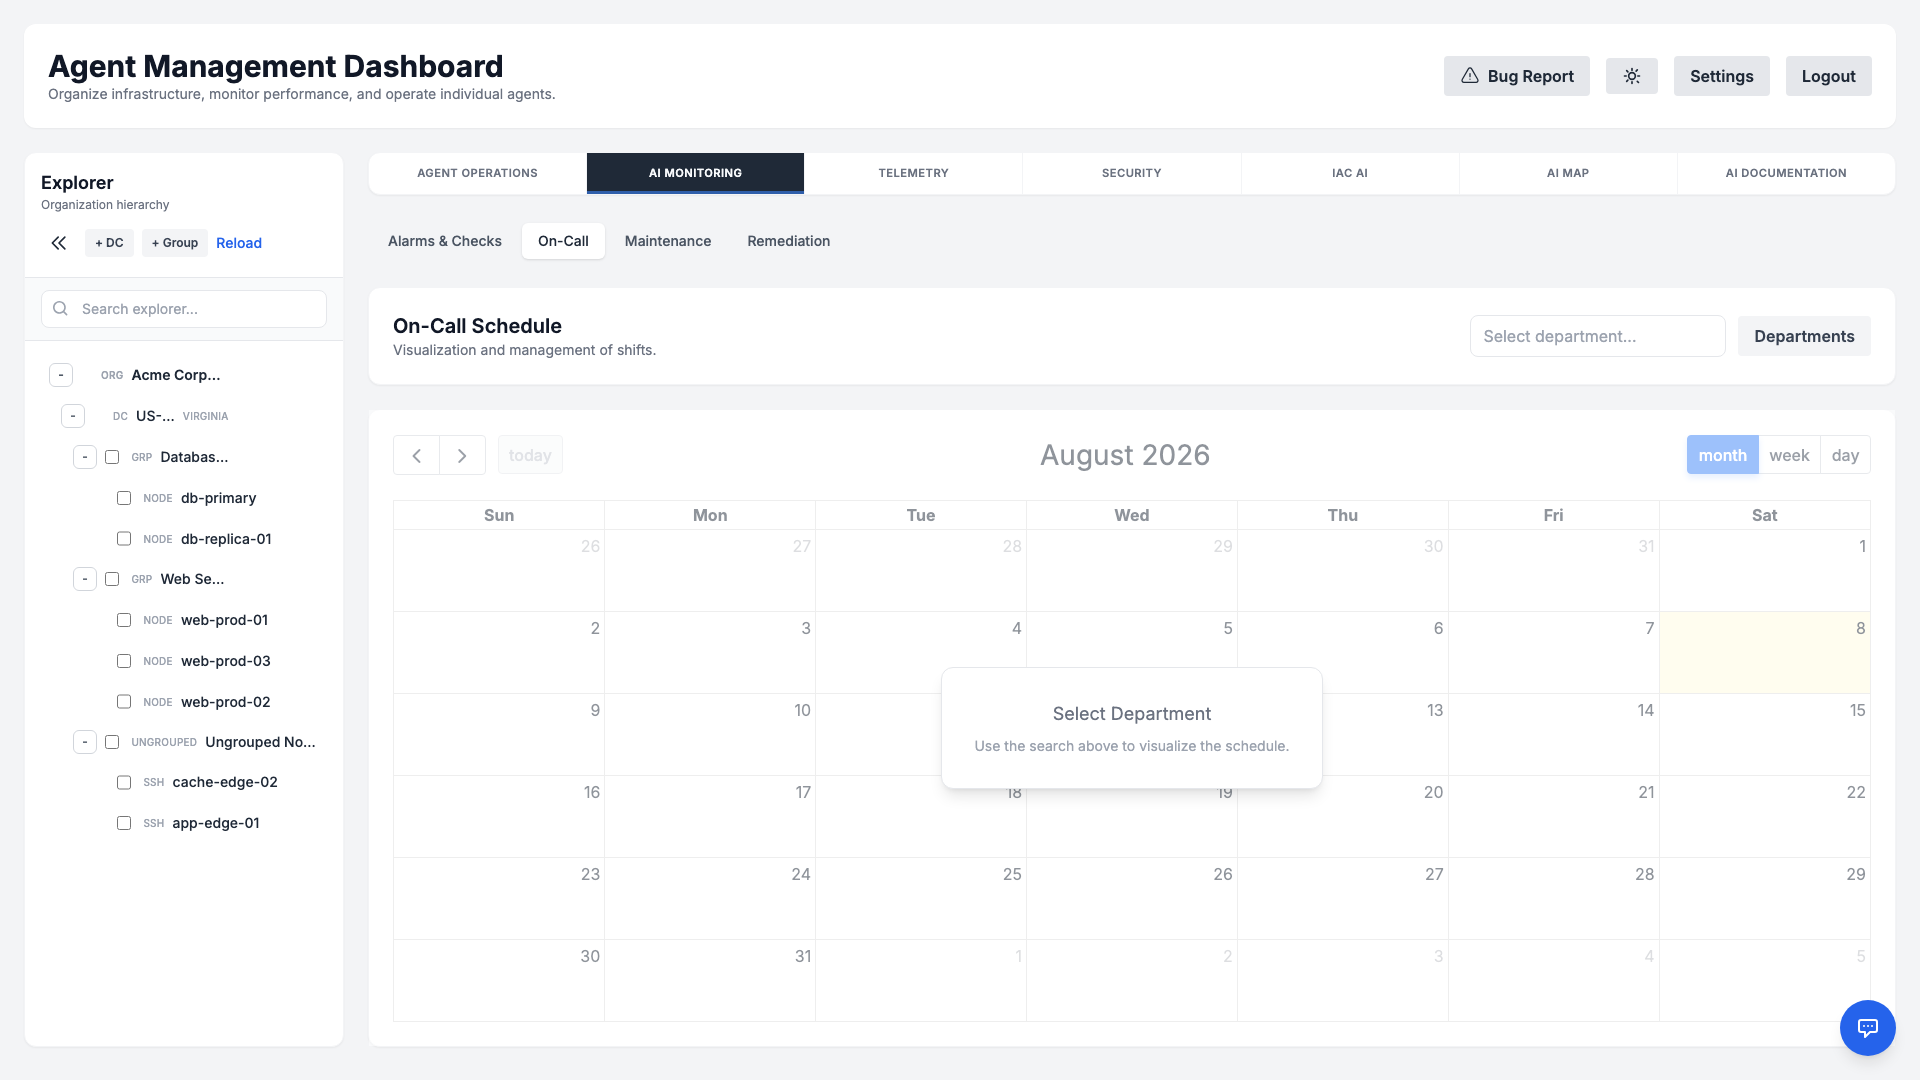
- Departments: Group responders by team (e.g., Platform, Database, Security).
- Schedules: Build the rota on a calendar — add a single shift, or generate a rotation from a list of engineers, a start date, a shift length and an interval. Note that the schedule records who is on call; the paging order itself comes from the department's escalation rules, which are not filtered by the calendar.
- Escalation rules: Each step names a responder and how long to wait before the next one, so an incident that nobody acknowledges climbs the chain instead of going quiet. Acknowledging stops it. Build the chain in the Escalation Chain panel under the calendar; a department with no steps pages nobody. Escalation reaches responders by email. Departments and the escalation chain can only be changed by an Administrator; operators manage the rota itself.
Maintenance Windows
Avoid noisy, false alarms during planned work. A Maintenance Window temporarily suppresses alerting for a chosen scope — the whole organization, a datacenter, or a single agent — over a defined time range.
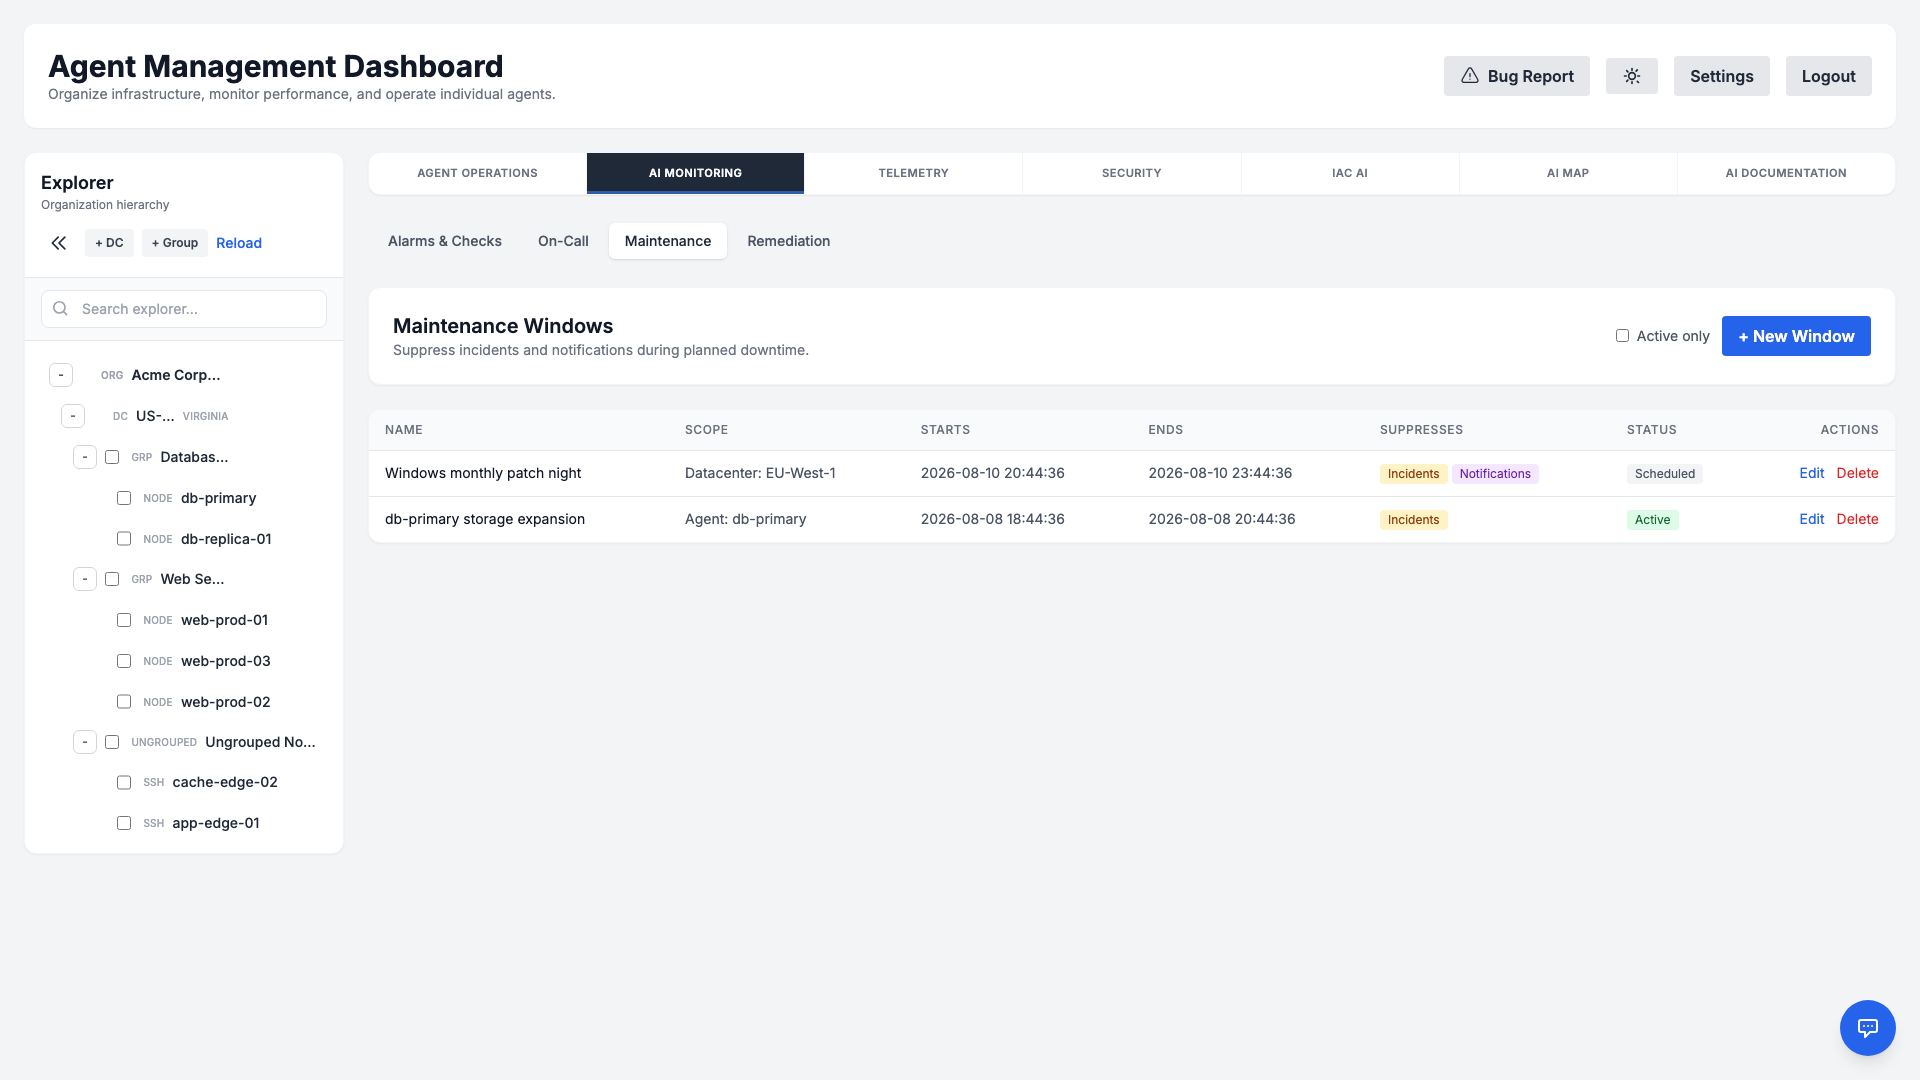
- Flexible scope: Apply a window to a single server, to every agent in a datacenter, or to the entire organization.
- Two independent switches: Suppress incident creation stops a failing check from opening an incident at all — which also stops auto-remediation, since a remediation is only triggered by a freshly opened incident. Suppress notifications stops warning and critical alerts going out, and pauses the escalation chain for the duration; an incident that was already climbing resumes where it left off once the window closes. Recovery notifications are never suppressed.
- Checks keep running: A window silences alerting, not monitoring. Results, telemetry and the alarm list carry on as normal, so you can still watch the host you are working on.
- Clear audit trail: Each window records who created it and why, and opening, changing or closing one is written to the audit log. Scheduling a window is an Administrator action — operators can see what is planned but cannot silence alerting — and no single window may span more than 30 days, so a mistyped end date cannot quietly suppress a tenant for years.
Auto-Remediation
Turn repetitive fixes into self-healing automation. A Remediation Rule binds a monitoring alarm to a saved Ansible playbook, so a failure you have seen before is diagnosed — and, once someone approves it, fixed — without anyone typing anything.
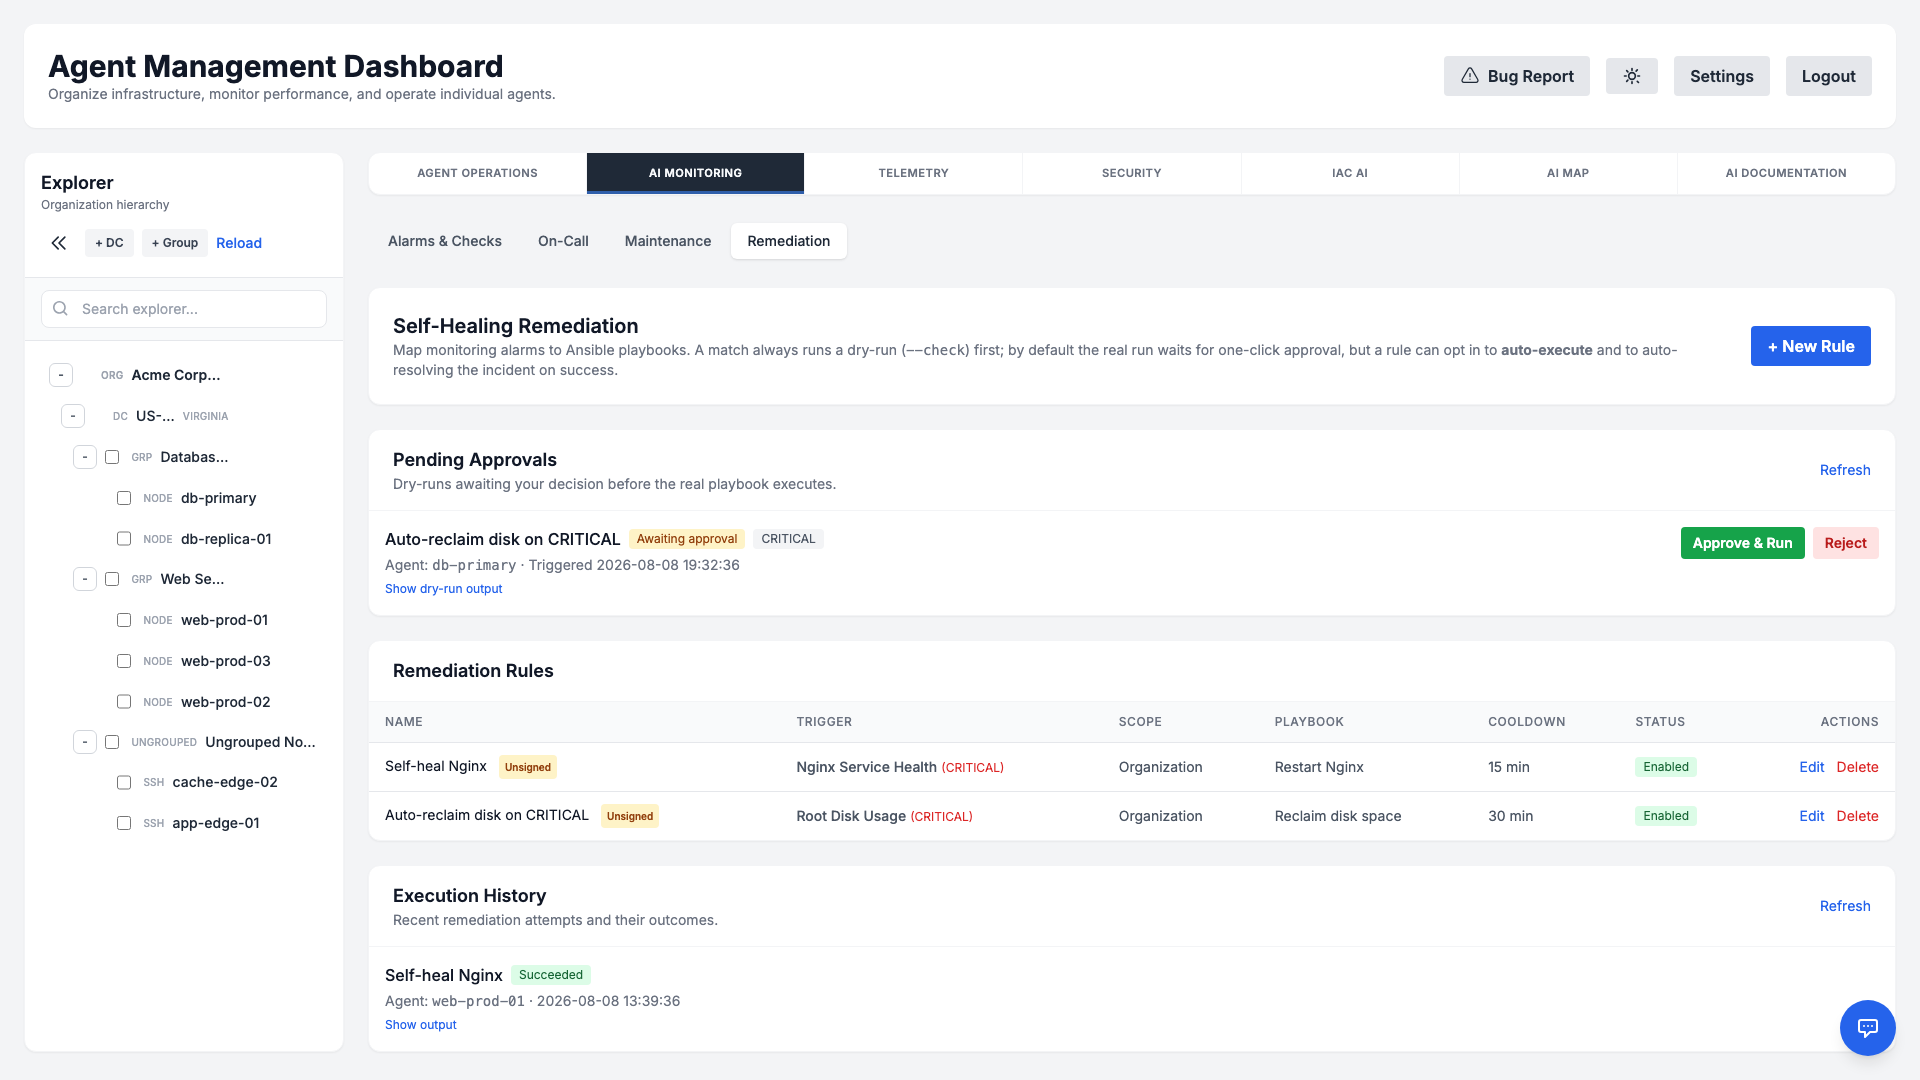
- Trigger: A monitoring check — matched by name or by id — opening a new incident at or above the rule's severity. A rule set to WARNING therefore also reacts to CRITICAL, and a check that is already alarming does not re-trigger while its incident stays open. The rule can be narrowed further to one agent, one machine group or one datacenter; where several rules match, the most specific one wins.
- Action: A saved Ansible playbook, run on the affected agent. Nothing runs straight away: the playbook is always executed in
--checkmode first, and if that dry run fails the rule stops there and nothing is changed. - Guardrails: A successful dry run waits for someone holding the Run Ansible and Run commands permissions to approve the real thing, unless the rule is explicitly opted into auto-execute. Authoring, editing or deleting a rule needs those same permissions, because a rule is command execution scheduled in advance. A cooldown stops a flapping check re-triggering the same fix. And because a remediation is only ever triggered by a freshly opened incident, a maintenance window that suppresses incident creation also stops it — a window that only suppresses notifications does not.
- History: Every attempt is recorded with its status, the dry-run output, the output of the real run, and either who approved it or that it ran automatically.
Telemetry
The Telemetry tab gives you a deep, time-series view of any single agent's health. Select a server in the Explorer and open Telemetry to see its historical metrics rendered as interactive charts.
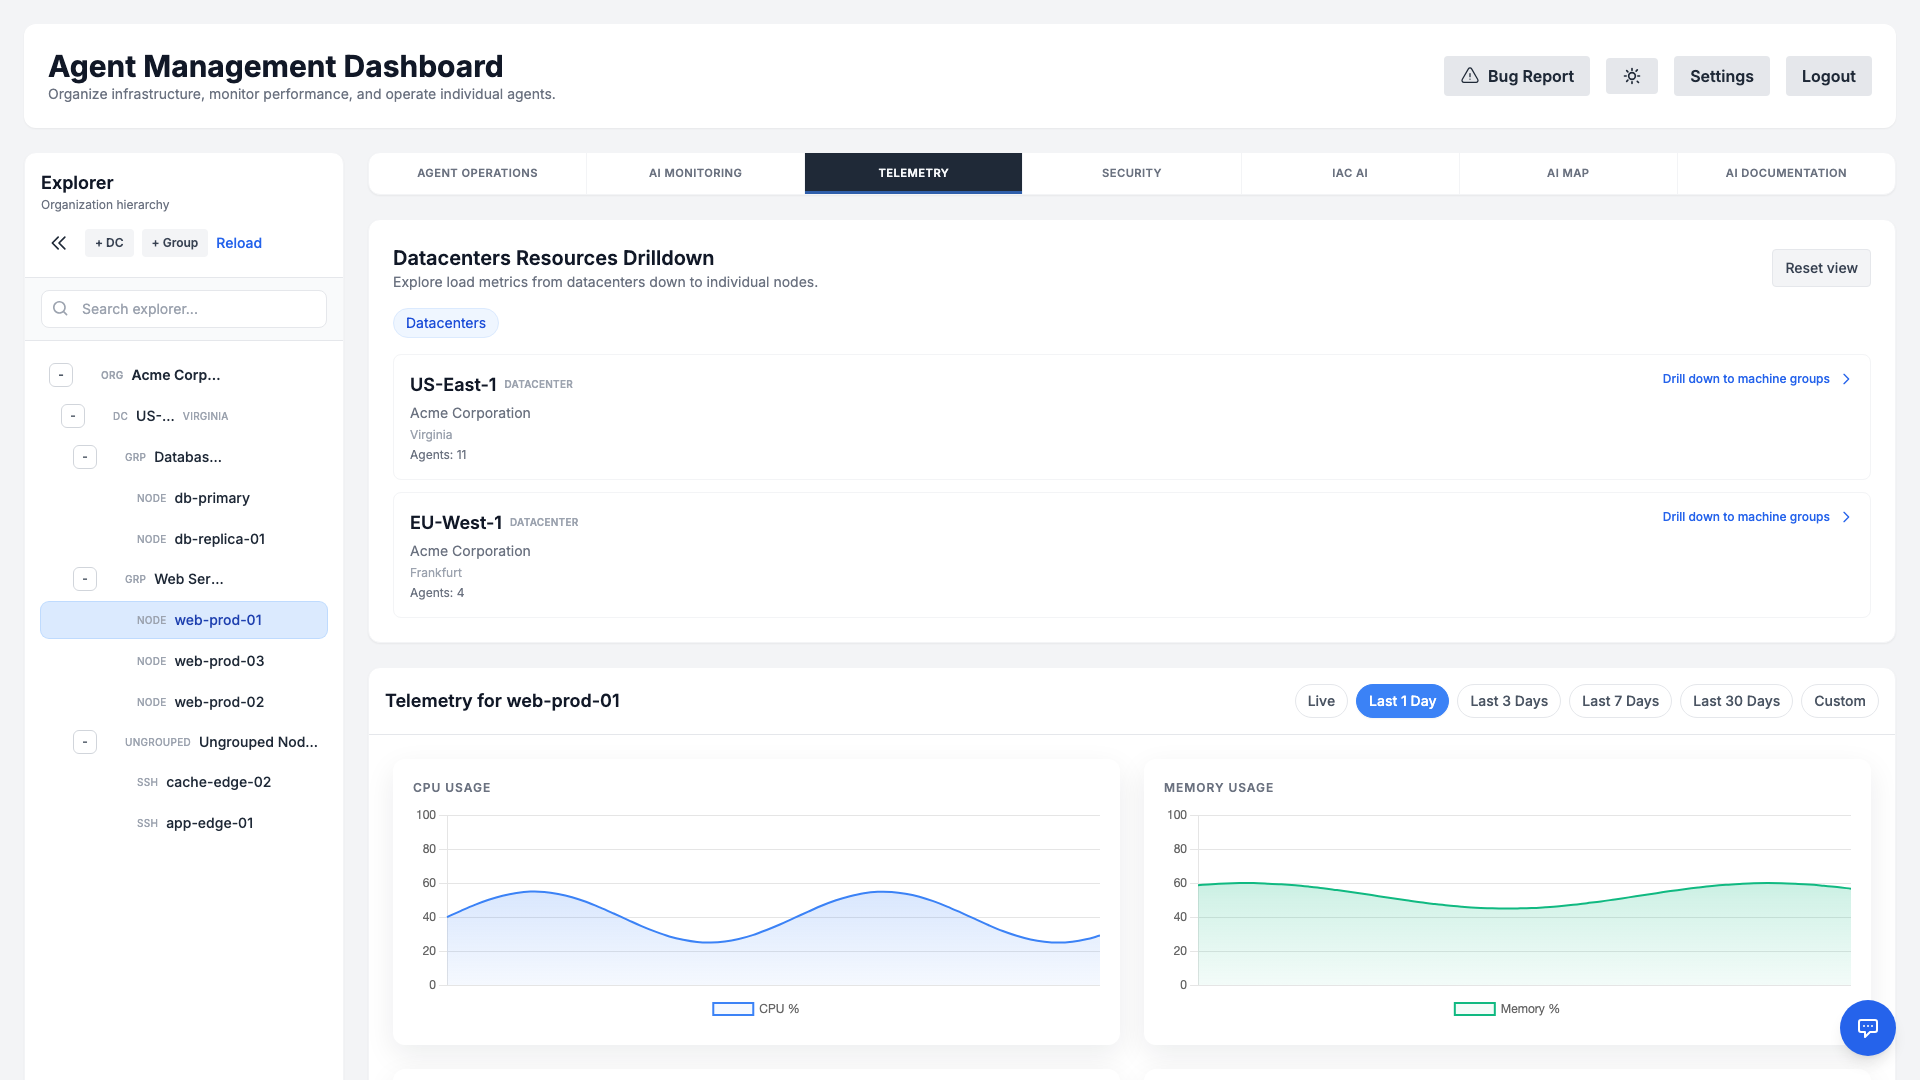
What you can see
- CPU & Memory usage over time, with selectable ranges (Live, 1d, 3d, 7d, 30d, or a custom window).
- Disk I/O — read/write throughput (KB/s), IOPS, utilization, and access time — plus disk usage percentage.
- Network throughput — bytes sent and received, totalled across the host's interfaces.
- Top processes by CPU and by memory, so you can immediately spot what is driving load.
How long history is kept
Per-minute samples are what makes an incident investigation possible, and they are also what makes a year of them unaffordable. Both are true, so the data is aged rather than deleted: raw samples are kept for 30 days, hourly aggregates for a year, and daily aggregates for two years.
Aging changes the resolution, not the subject. Every series on this page — processor, memory, disk usage, disk throughput and IOPS, utilisation, access time and network — is carried into the aggregates as an average and a peak per mountpoint, device and interface. So a range from last spring draws the same charts as a range from this morning; the points are hourly means rather than per-minute readings. The one thing that does not survive is the top-process tables: those are point-in-time snapshots of what was running, and averaging them would be meaningless, so they are available for as long as the raw samples are. The page says which kind of answer you are looking at.
While the raw samples still cover the window you asked for, they are what answers it, whatever the range. Retention never runs ahead of aggregation: raw samples are only removed once they have actually been rolled up, so a rollup that has not yet run cannot cause silent data loss. Charts and the AI read the same numbers, so a long-range answer and the graph beside it cannot disagree.
Switch to the Live range to follow a connected agent in near real time — a rolling five-minute window the manager keeps in memory and the page refreshes as new samples arrive — or pick a historical range to investigate a past incident. The same telemetry feeds the Predictive Analytics forecasts below.
Predictive Analytics
The system includes built-in Predictive Monitoring, enabled by default. The manager re-reads each host's stored telemetry once an hour and fits a trend to it, so a resource that is going to run out announces itself while there is still time to do something about it.
Algorithms Used
- Linear Regression (Disk Usage): Fits the fill rate of each mountpoint over the last 30 days and extrapolates to 100%. A mountpoint that is flat or emptying is ignored.
- CRITICAL: Predicted to fill within 7 days.
- WARNING: Predicted to fill within 14 days.
- Holt's Linear Trend (CPU & Memory): Uses exponential smoothing over the last 7 days to detect saturation trends.
- CRITICAL: Forecast > 95% saturation.
- WARNING: Forecast > 85% (CPU) or > 90% (Memory).
A forecast needs something to extrapolate from: at least three telemetry samples carrying disk usage, and ten carrying CPU or memory. Below that the host is skipped silently rather than being reported as healthy. Nothing needs configuring, and it applies to every host the manager has telemetry for — Linux, Windows and agentless SSH hosts alike, since the forecast runs on the manager rather than on the host.
Forecasts surface alongside your other checks as system alarms — System: Predictive Disk Space, System: Predictive CPU Saturation and System: Predictive Memory Saturation — in AI Monitoring → Alarms & Checks, and trigger your configured notification channels and on-call escalations exactly as a normal check does. When the trend recovers, the next hourly pass posts an OK result and the alarm clears itself.
Security Scanning
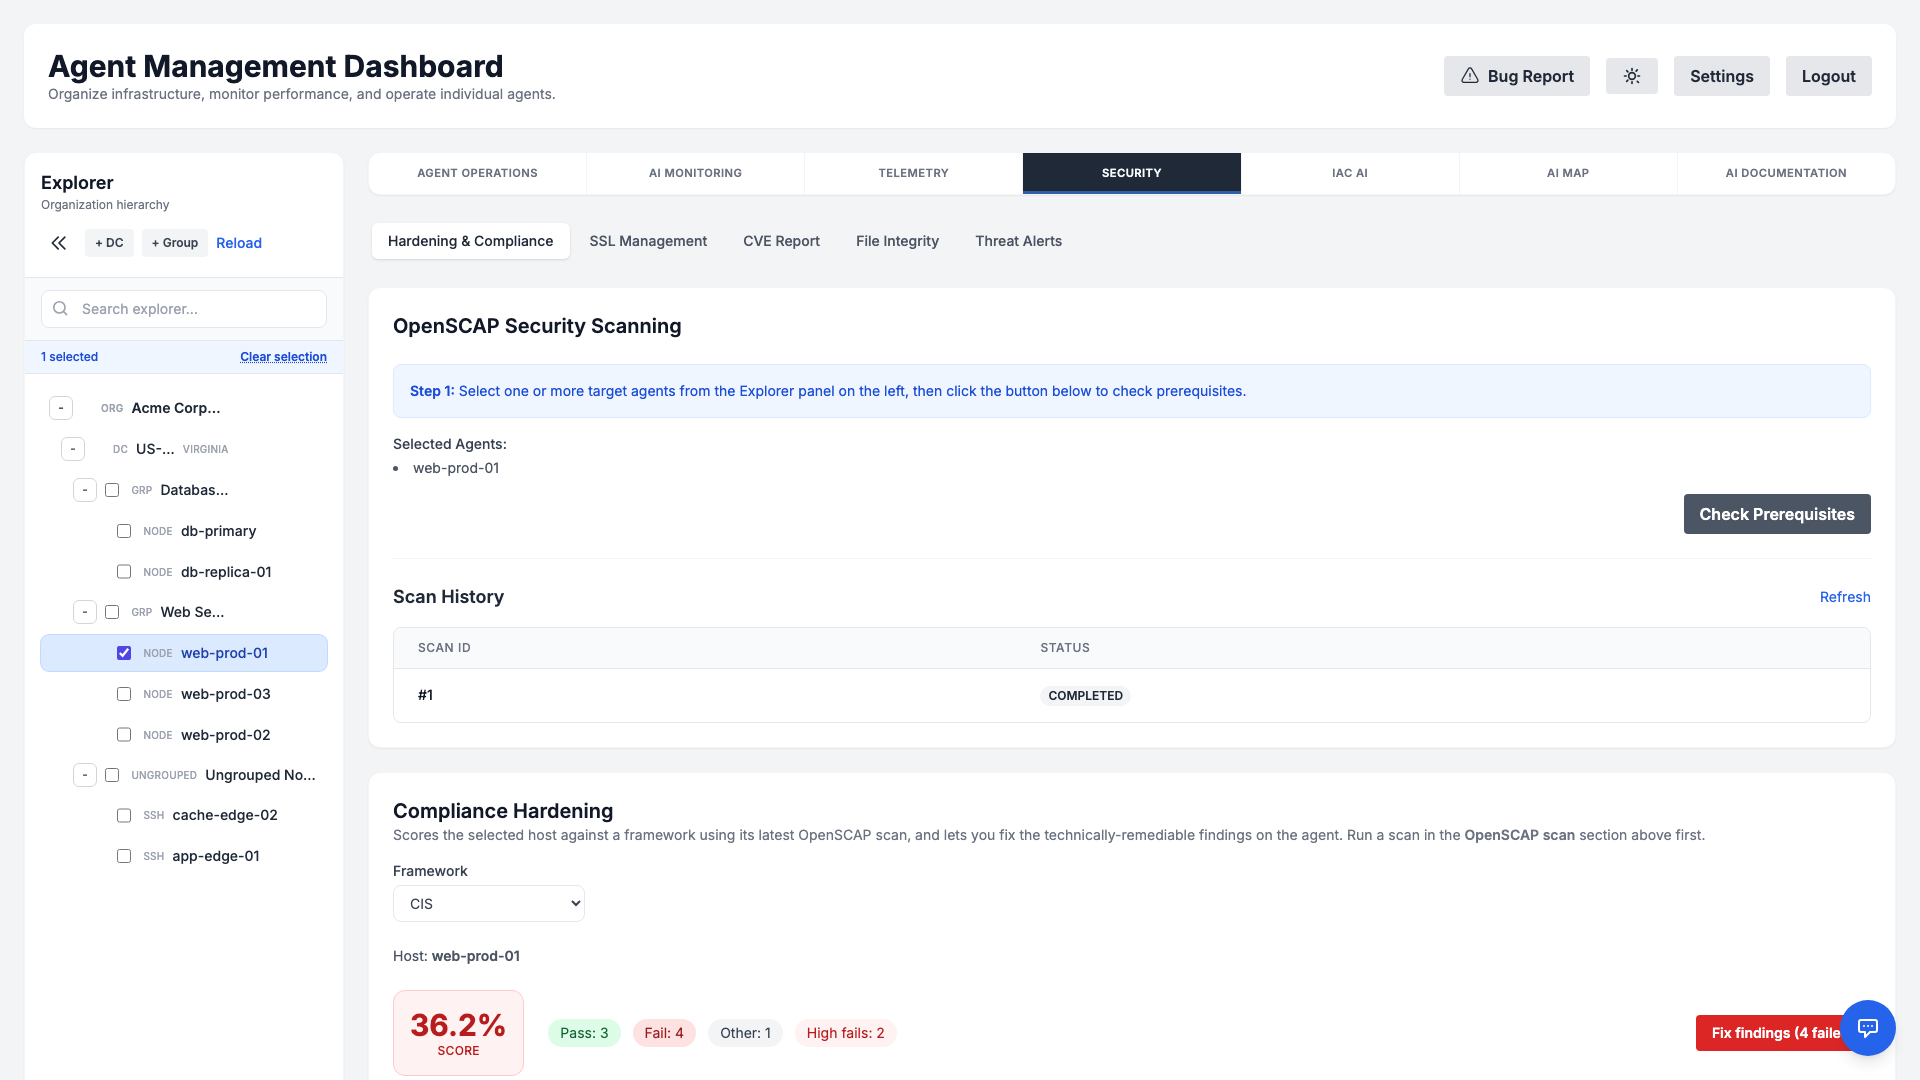
Measure your Linux hosts against a recognised hardening baseline with OpenSCAP. Pick a profile — PCI-DSS, HIPAA, CIS, STIG and whatever else the host's SCAP content offers — and the agent evaluates every rule in it and reports each one as passed, failed or not checked, with its severity and rule id.
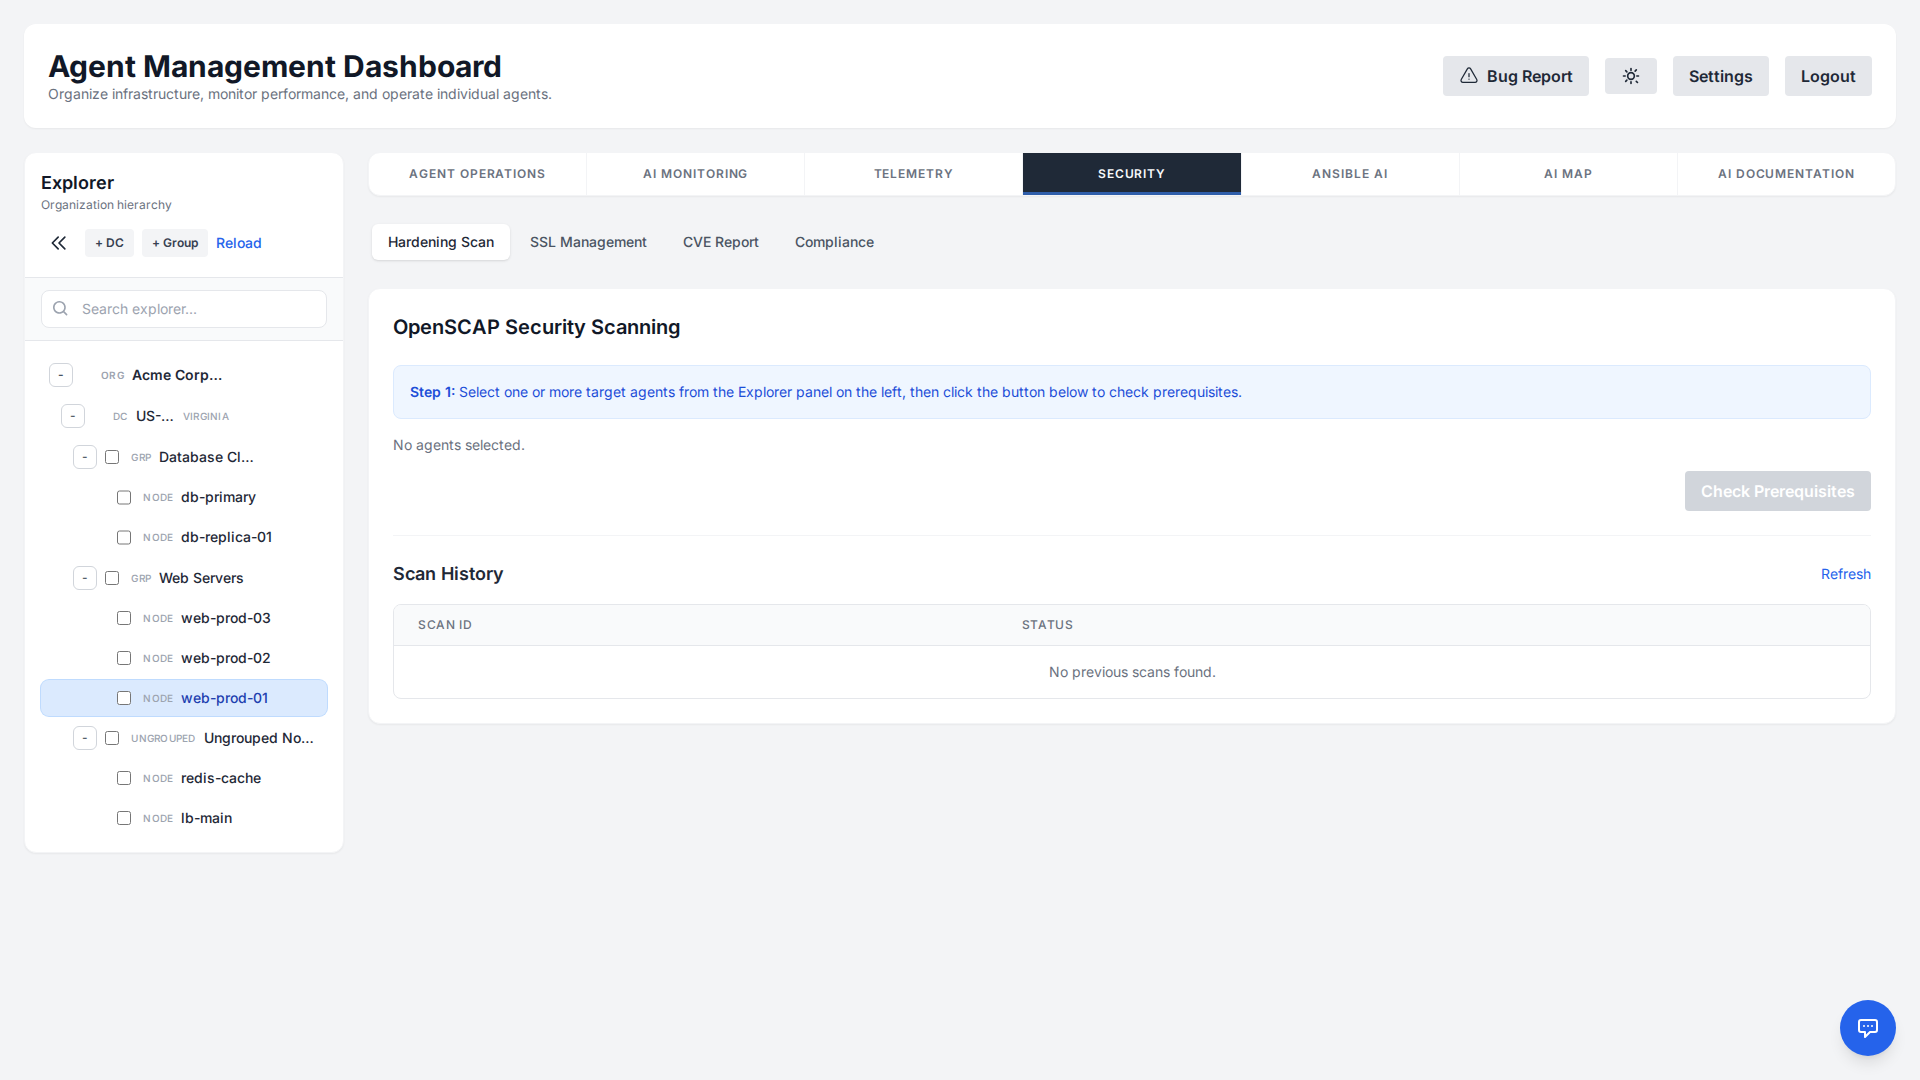
The profile list is not a fixed menu: it is read from the SCAP content actually installed on the host, so you are only ever offered profiles that machine can be measured against. If the tooling is missing the dashboard says so and can install it for you. Scans are started from the dashboard against the hosts you select and require the Run security scans permission; there is no recurring schedule — you run them when you want the answer.
For failed rules you can generate a remediation script, and there are two kinds — the difference matters, because you are the one running them as root. Picking specific rules gives you the fixes the SCAP Security Guide ships inside the profile itself, pulled out of the report and assembled into one script; nothing there is written by a model. Fix all failed instead asks your configured AI to author a single consolidated script for everything failing in the chosen framework — it uses the built-in fixes as reference and writes its own for the rules that have none. That one is labelled as AI-authored in the dialog. Either way the script is editable, nothing runs until you press apply, and both go out through the same approval-gated path.
Beyond the raw pass/fail list, Compliance Hardening scores the selected host against a framework — CIS, STIG, PCI-DSS, HIPAA and others, plus governance frameworks like SOC 2 and ISO 27001 that are measured against the CIS technical baseline — and shows the count of passes, failures and failures at high severity. Controls that cannot be measured from a machine at all are listed separately as procedural, rather than being quietly counted as passes.
Windows hosts are not covered by this. OpenSCAP is a Linux toolchain and there is no equivalent baseline scan for Windows, so Windows machines are refused up front rather than failing mid-scan; what they get instead is CVE scanning, which answers a different question — missing patches rather than configuration hardening.
SSL Management
The platform automatically scans for and inventories SSL certificates on your servers, alerts you before they expire, lets you order and auto-renew certificates from a commercial CA, and replaces them from a secure local certificate store — all from the dashboard.
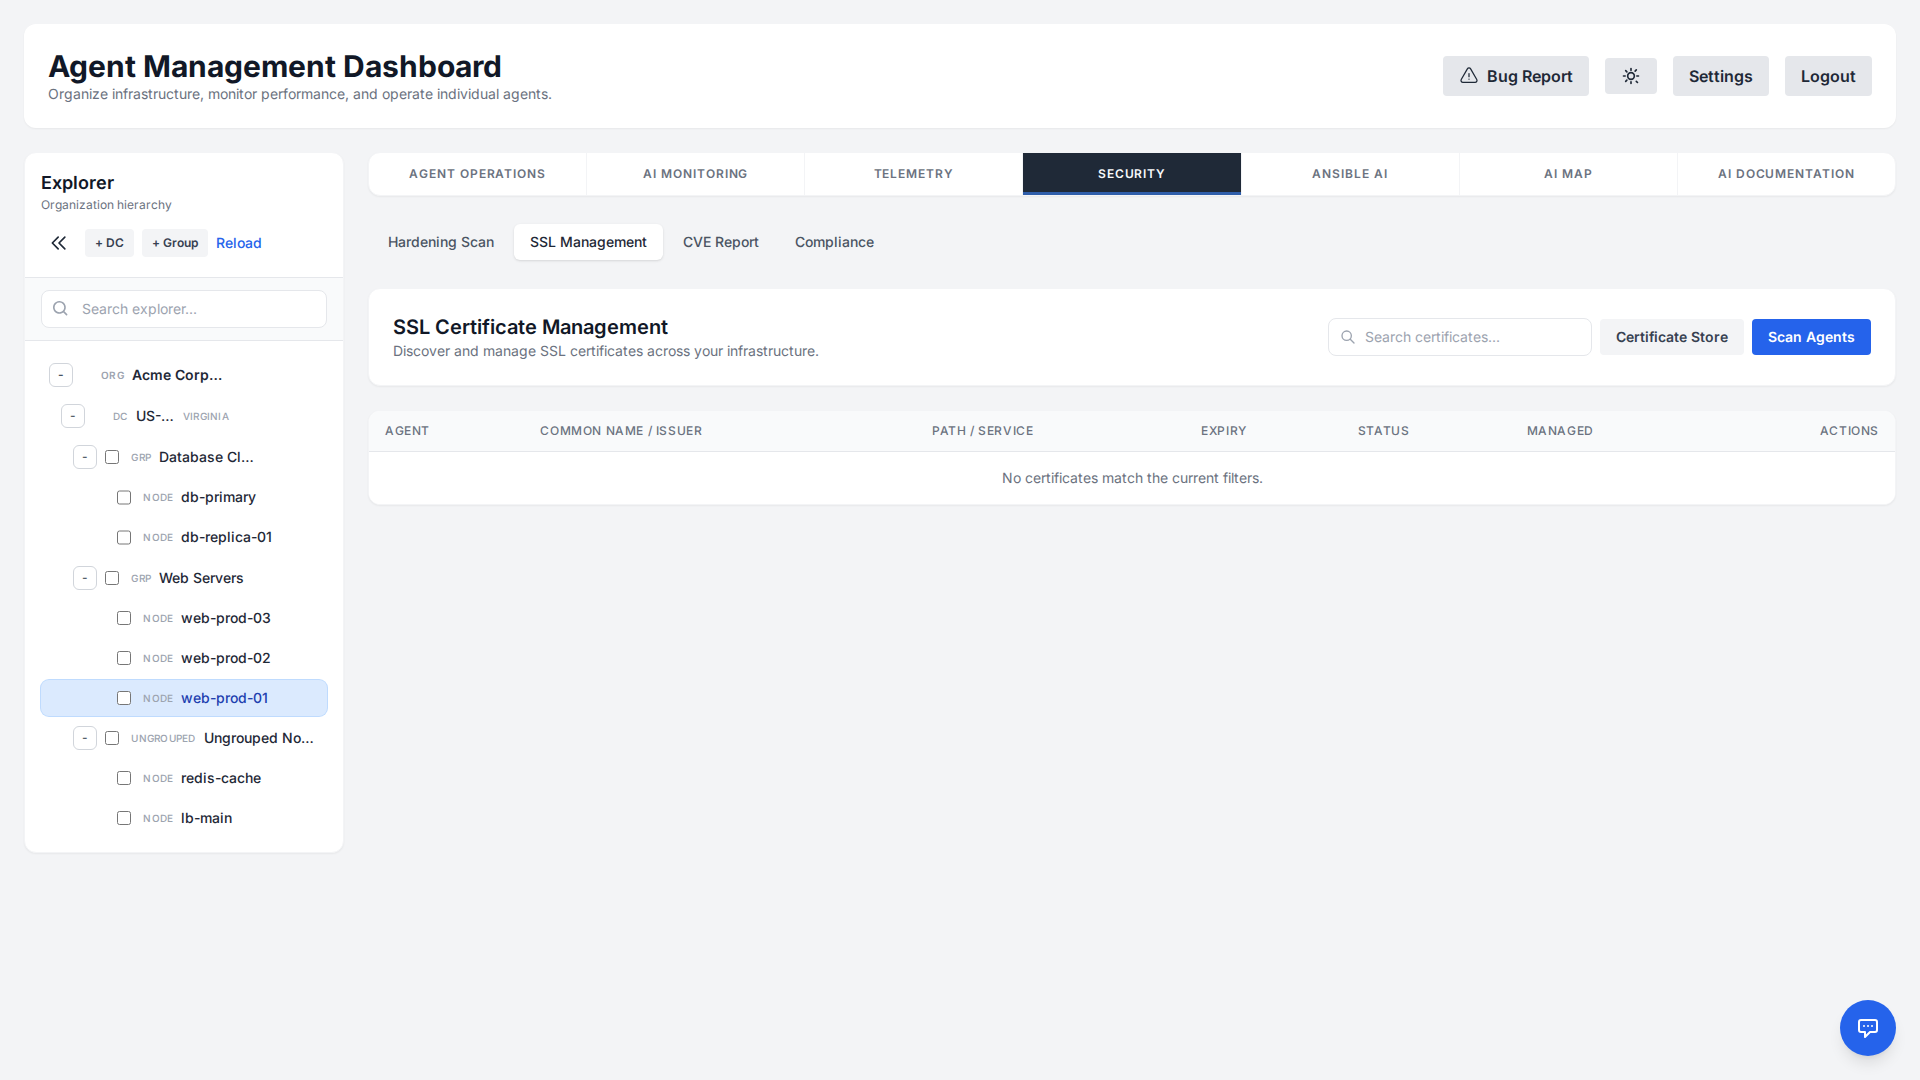
Discovery & Inventory
A discovery script walks the usual certificate locations — /etc/ssl/certs, /etc/pki, the nginx and Apache configuration trees and anything else you add — and on Windows it also reads the Windows Certificate Store (LocalMachine\My, WebHosting, Root and CA) as well as the IIS content directories under C:\Inetpub.
On Linux it parses .pem, .crt and .cer. On Windows it additionally opens .pfx, .p12, .der, .p7b and .p7c — though a .pfx protected by a password is skipped rather than prompted for, since discovery runs unattended.
It extracts key details:
- Common Name (CN)
- Issuer
- Expiration Date
- Associated Service, inferred from where the file lives — a certificate under the nginx tree is attributed to nginx, one under
C:\Inetpubto IIS. This is a path heuristic, not a binding lookup: IIS site bindings are not queried, so a certificate bound to a site but stored elsewhere is inventoried without that association.
Expiration Alerts
The platform continuously watches every discovered certificate and raises an alert as expiry approaches, so a forgotten renewal never causes an outage:
- WARNING: The certificate expires in less than 30 days.
- CRITICAL: The certificate expires in less than 7 days.
These alerts flow through the same incident and notification pipeline as your monitoring checks, so they reach your configured channels and on-call schedule.
Issue & auto-renew certificates
Beyond discovery, you can order certificates from a commercial Certificate Authority — DigiCert, Sectigo, or GlobalSign — without leaving the dashboard. From SSL Management, click Order Certificate to open the ordering workflow.
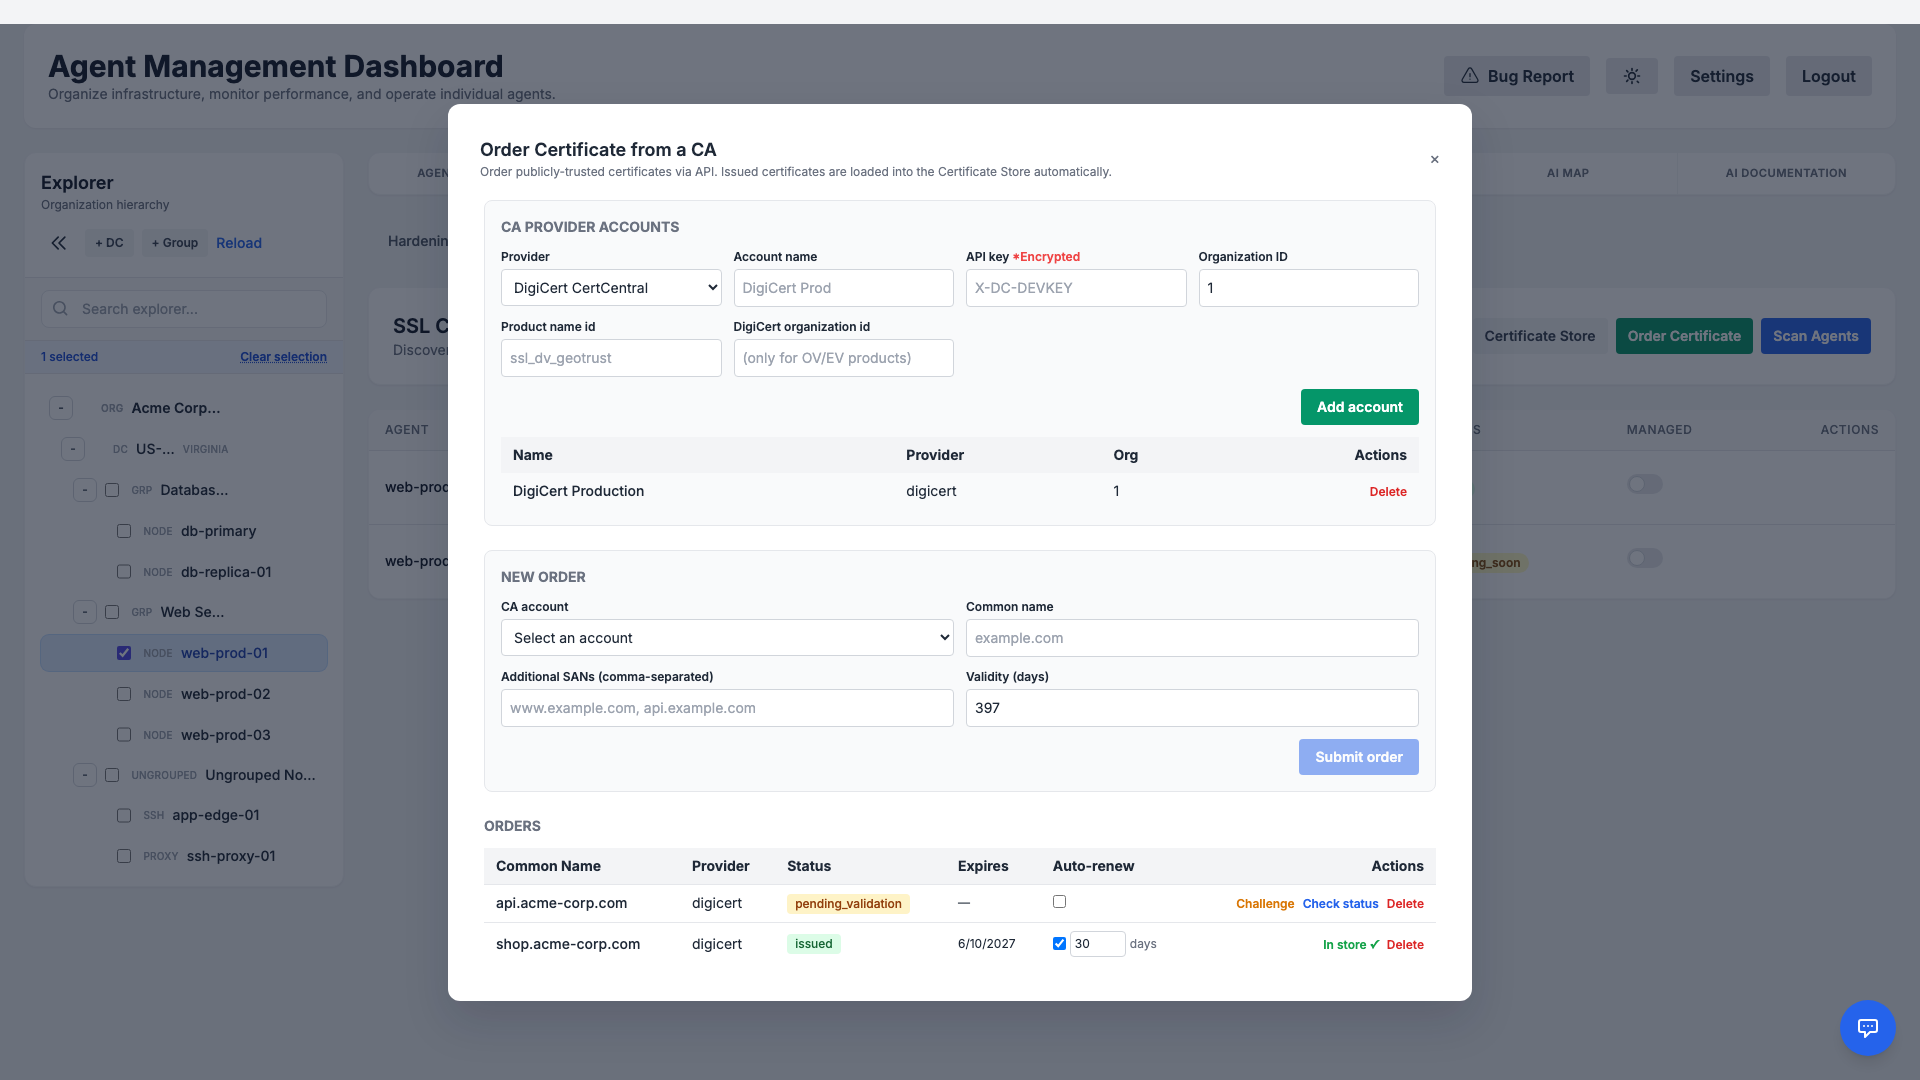
- Add a CA provider account. Store your CA API credentials once (encrypted at rest, never returned to the browser) plus any provider-specific options such as the DigiCert product and organization id.
- Create an order. Enter the domain (Common Name) and any additional SANs and submit. The manager generates the private key and CSR locally and sends only the CSR — your private key never leaves your infrastructure and is never sent to the CA.
- Prove domain control. The platform shows the DNS TXT (DCV) challenge to publish. Once the record is live, click Check status; when the CA issues the certificate it is downloaded and loaded straight into the Certificate Store below.
Each order can be set to auto-renew a configurable number of days before expiry. An hourly scheduler re-orders and re-issues automatically, so certificates you manage here never lapse. Issued and in-flight orders are listed with their status (issued, pending validation, failed), expiry, and auto-renew state.
Certificate Store & Replacement
You can replace or renew certificates directly from the dashboard. Upload a new certificate to the secure, organization-scoped Certificate Store (public key, private key, and optional chain/bundle), then deploy it to a target location on any agent:
- Store securely: Keep reusable certificates in the per-organization certificate store.
- Deploy on demand: Pick a target certificate path on an agent and the stored certificate to install.
- Review before applying: The platform generates an AI-assisted deployment plan that you review and confirm before it runs on the agent.
The private key is never put into the deployment script. It is stored encrypted under your organization's key, the AI that drafts the plan is told only that the key will be in an environment variable, and the manager resolves that variable at the moment the command is dispatched — the agent receives it as ephemeral environment, which it passes to the process and never writes to disk. So the key is absent from the prompt sent to the model, from the plan shown in your browser, and from the command history kept for that host. A deployment queued while the agent was offline gets the same treatment when it is re-sent, and a reference that points at another organization's certificate is refused.
CVE Scanning
Stay ahead of known vulnerabilities across your fleet. The CVE Scanner asks each host's own update tooling which security updates are pending, then resolves those packages to published CVEs so you can prioritize patching by severity.
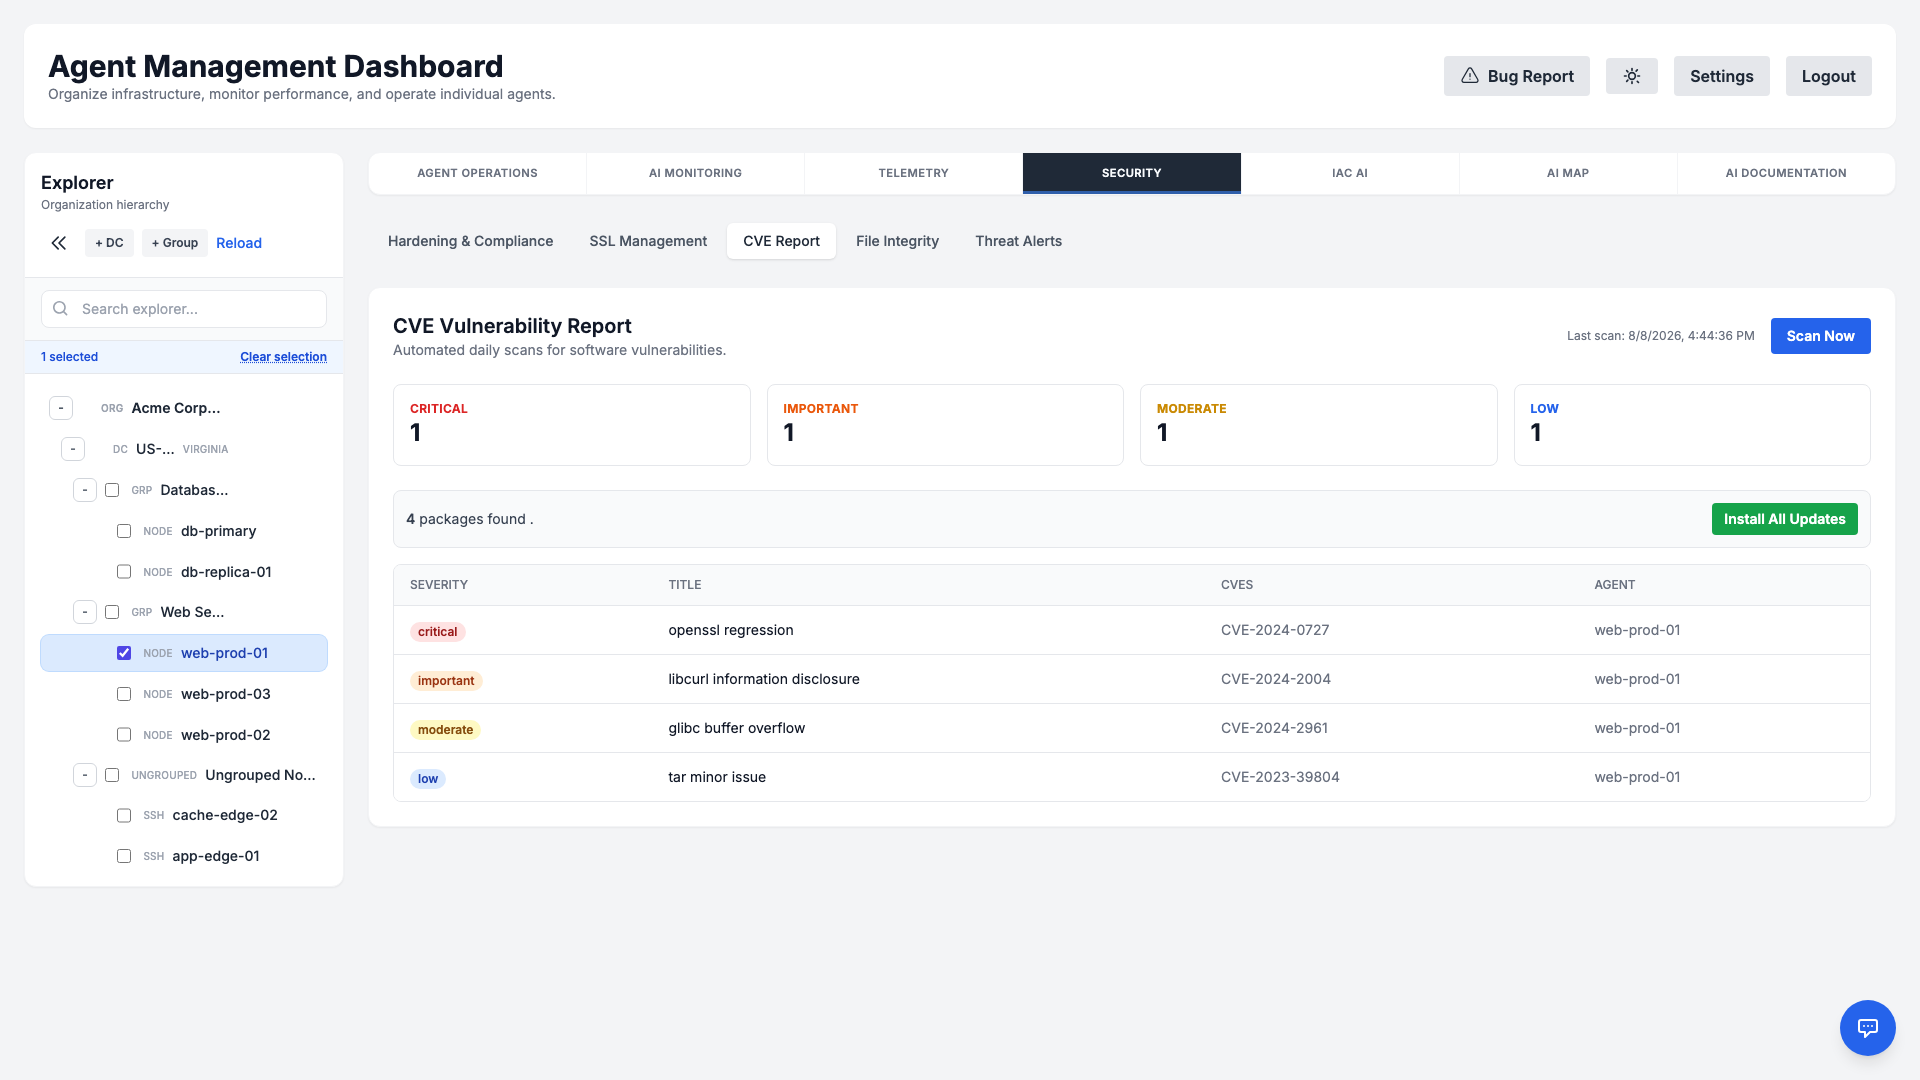
- Severity breakdown: Results are summarized by Critical, Important, Moderate and Low, plus Unknown for anything the feeds could not rate.
- Cross-platform: On Debian and Ubuntu the pending security updates are matched against published advisories to give you the CVE and its distribution priority. On RHEL, Rocky, AlmaLinux and Fedora the vendor advisory and its severity come straight from
dnf updateinfo. On Windows the scan queries Windows Update for the CVE identifiers, KB articles and Microsoft severity of updates that have not been applied. - Actionable detail: Each finding lists the affected package, the version installed when it was found, the related CVE identifiers and a short description.
- Patching: Remediation applies the pending updates and reports whether a restart is required — through the package manager on Linux, and through the same Windows Update session the scan already queries on Windows, so nothing extra has to be installed on the host. It applies every pending update rather than only the vulnerable package, requires the command-execution permission rather than the scanning one, and is written to the audit log.
The scan itself only reads. It runs as a signed observe-only command, installs nothing, and needs no internet access on the host: the lookup against the advisory feed happens on the manager. If that feed is unreachable, or you run air-gapped and turn it off, the scan still reports which packages have a pending security update — those findings are simply labelled SECURITY-UPDATE with a severity of Unknown rather than being given identifiers nobody could look up.
Compliance Reports
Demonstrate adherence to common frameworks with on-demand Compliance Reports. The platform consolidates scan results and configuration evidence into shareable, AI-generated assessments for the standard you select.
Choose from the following supported frameworks:
- SOC 2 Type II — Security and availability trust-service criteria.
- ISO 27001 — Information security management system controls.
- HIPAA — Safeguards for protected health information.
- DORA (EU) — Digital Operational Resilience Act ICT risk and resilience requirements.
- NIS 2 (EU) — Cybersecurity risk-management measures under the EU NIS 2 directive.
Reports render as formatted HTML you can review in the dashboard. Download report saves a self-contained HTML file — the report, its standard and the time it was generated, with no external assets — which is what you hand to an auditor or attach to an evidence request; Export PDF / Print opens your browser's print dialog for a PDF. Every export is written to the audit log, so you can show who took a copy of the evidence and when.
The control analysis is grounded in what was actually measured. Each host's most recent hardening scan is re-scored against the control families the selected standard cares about, and those scores, the per-family pass and fail counts and the failing rules are what the report is written from, alongside the host's CVE totals, its active alarms and its certificates. Where a host has no scan behind it, the report says the evidence is missing rather than inferring a result. A report is a point-in-time snapshot of the hosts you selected, not a certification.
File Integrity Monitoring (FIM)
Detect unauthorized or unexpected changes to critical files. File Integrity Monitoring establishes a cryptographic baseline for the paths you choose, then re-fingerprints them on a schedule — hourly by default — and reports what moved. It is a periodic comparison, not a live filesystem watcher: a file changed and changed back between two passes is not reported.
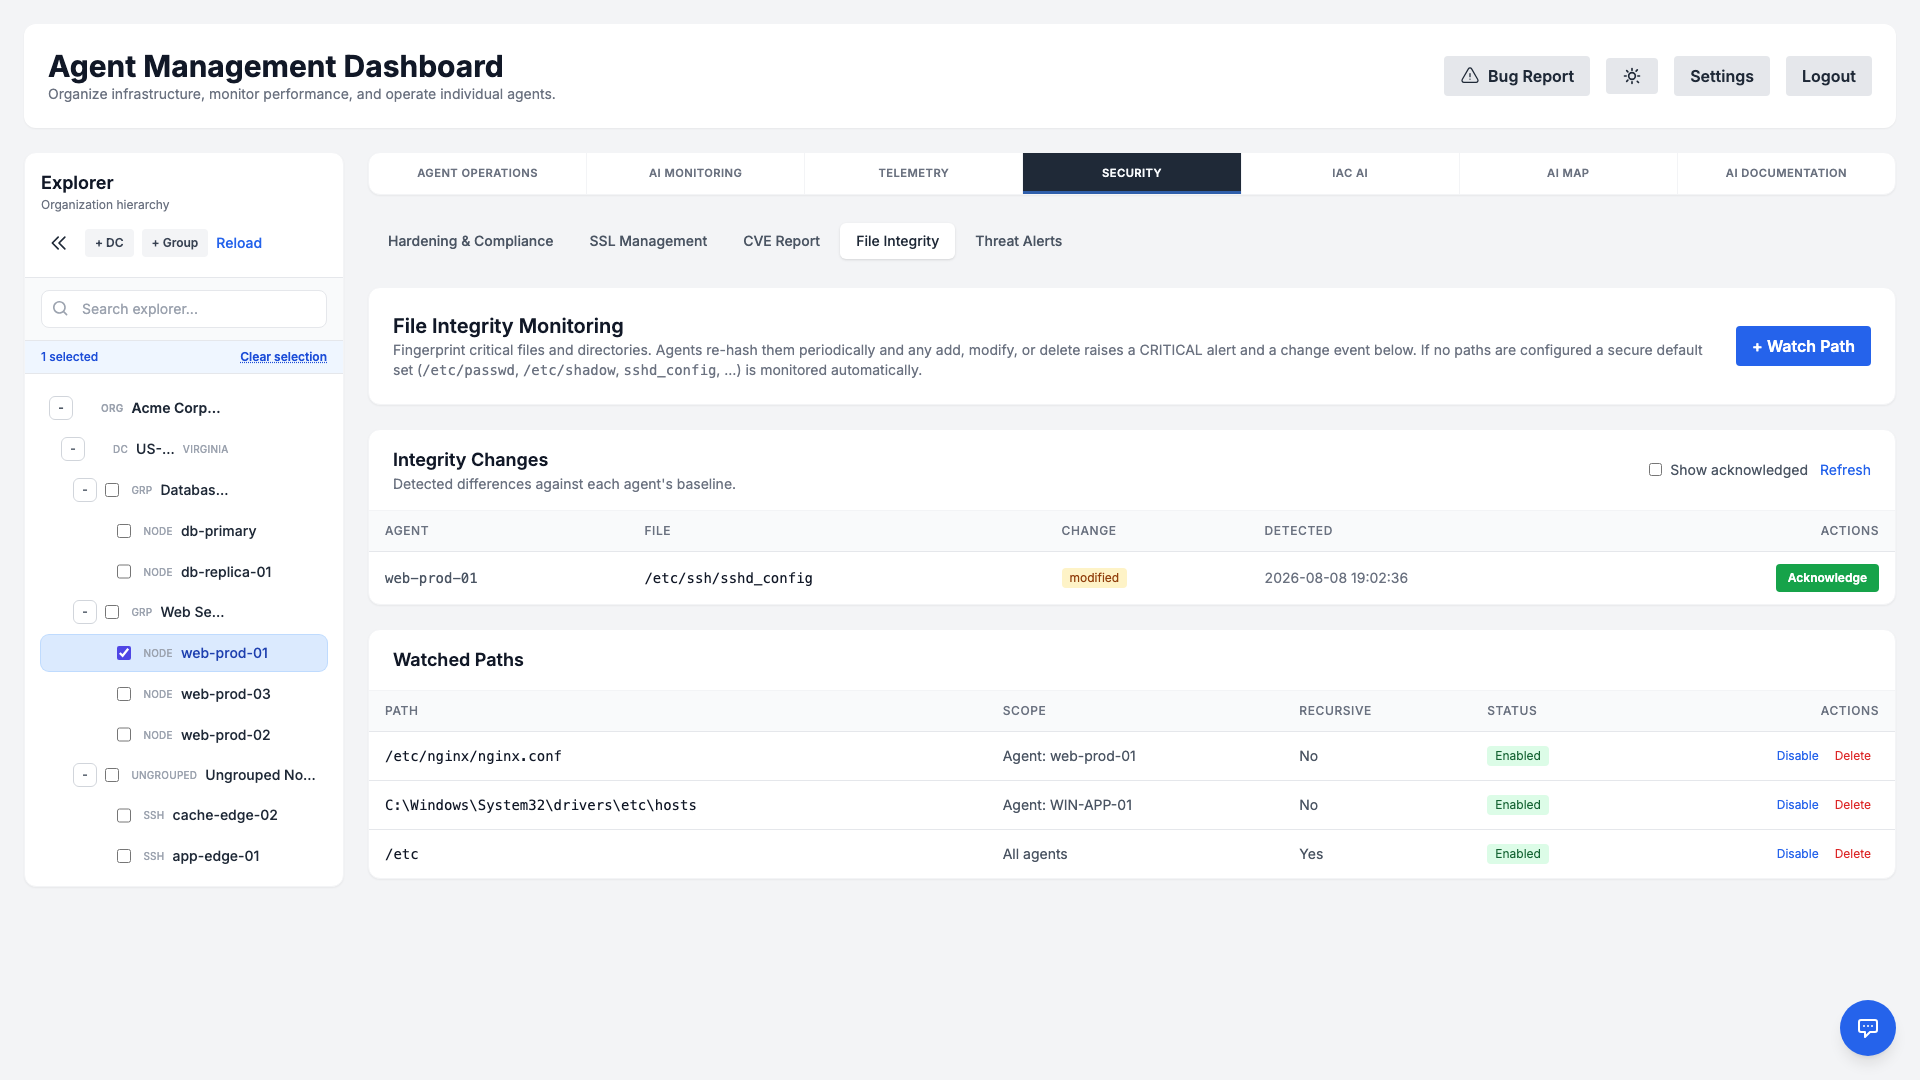
- Monitored paths: Track sensitive files and directories, per host or across the whole organization. Out of the box a Linux host watches
/etc/passwd,/etc/shadow,/etc/sudoers, the SSH server config and/etc/systemd/system; a Windows host watches thedrivers\etcdirectory, the scheduled-task folder and the startup folder. The locked SAM and SYSTEM registry hives are deliberately left out — they cannot be read while Windows is running, so watching them would produce nothing but errors. You can add your own paths on either platform. - Baseline hashes: Each file is hashed with SHA-256, alongside its size, mode and owner. The first pass establishes the baseline and raises nothing; every later pass is compared against it.
- Change events: Additions, modifications and removals each generate an event showing the path, what changed and when. The hashes are recorded, never the file contents. A change raises a Security: File Integrity alarm through the normal monitoring path, and acknowledging every outstanding change on a host clears it.
- Acknowledging is not approving. Acknowledging an event silences the alarm and records who did it; the baseline rolls forward only when a later scan sees the file settled. Every acknowledgement is written to the audit log.
Threat Alerts
Runtime threat detection watches host-local signals — suspicious service behavior and out-of-scope interactive sessions — and surfaces a verdict in the Threat Alerts tab under Security. Most findings never reach a model at all: they are settled by a deterministic rule on the manager. What is stored against an alert is the verdict plus a short evidence excerpt — the last twenty observed events — not the whole session.
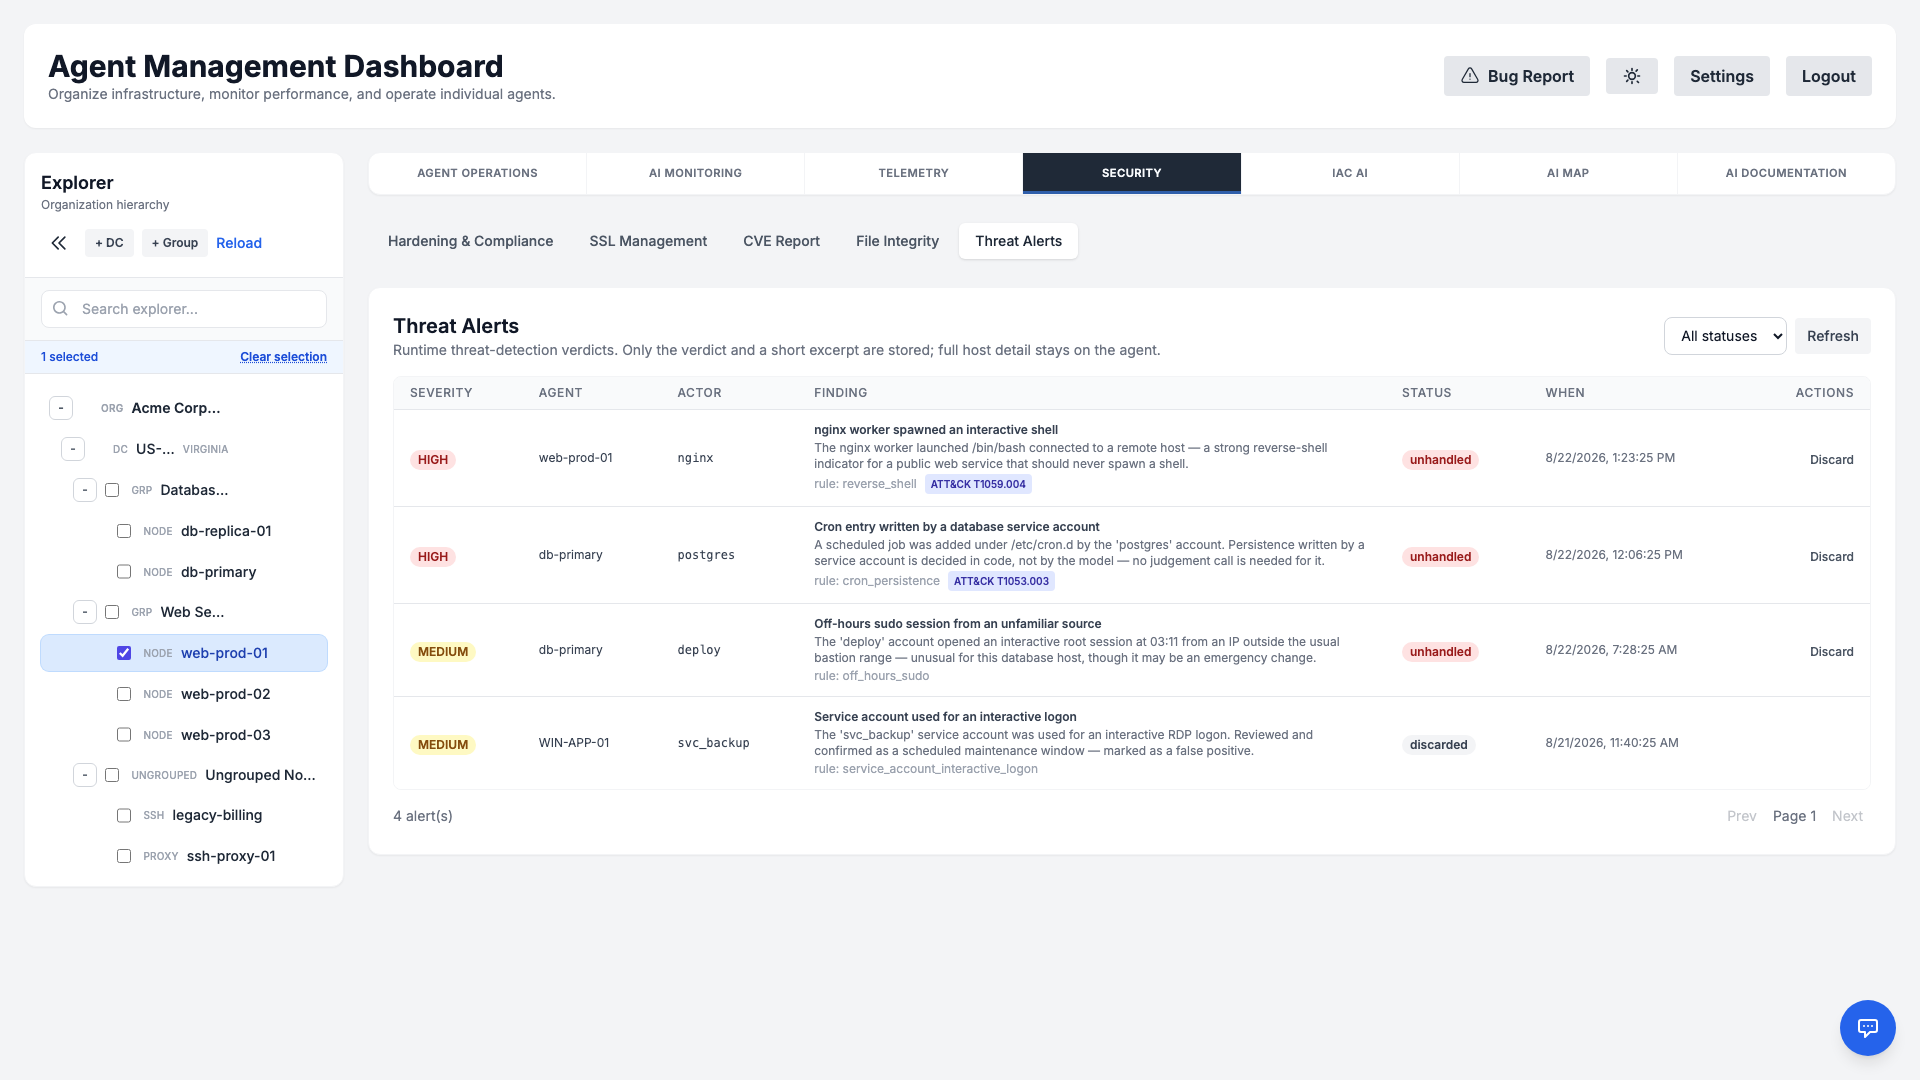
- Decided in code where no judgement is needed: Some signals are malicious whatever the host is for — a reverse-shell command line, a download piped straight into an interpreter, a service reading the shadow file, persistence written to
cron,authorized_keysor a systemd unit. Those are settled by a deterministic rule before the model is consulted, so the verdict is instant, reproducible and unit-tested. Genuinely ambiguous signals still go to the AI: a shell spawned by an application server may be a deploy hook or a webshell, and only the host's role tells you which. - MITRE ATT&CK technique: Rule-decided findings carry their ATT&CK technique (for example
T1059.004for a reverse shell,T1053.003for cron persistence), shown as a badge that links to the technique page. AI-judged findings carry no technique rather than a guessed one. - Severity & kind: Each finding is graded High or Medium and classified as a suspicious service or session; benign activity never raises an alert.
- Plain-English explanation: The verdict explains why the behavior was flagged — for example, a public web service spawning an interactive shell — along with the rule that fired.
- Triage workflow: Filter by status and Discard false positives; repeat fires of the same finding are coalesced into a single row. Discarding is written to the audit log.
- What reaches the model, and what it looks like: Rule-decided findings are judged entirely on the manager and no model is called. When a signal is genuinely ambiguous, the observed events — process, parent, and the command line, up to fifty of them — are sent to whichever AI provider your organization has configured, along with the hostname and the host's role. Command lines are passed through the same credential redaction used elsewhere in the product, so passwords, bearer tokens, connection strings and key blocks are masked before they leave the manager and before they are stored. If your policy is that command lines must not leave your infrastructure at all, run a local model (see Local LLM) or turn threat detection off per agent or machine group.
- Linux and Windows: Each platform has its own detections and its own ATT&CK technique, because they are not the same behaviour. On Linux: reverse shells, a download piped into an interpreter, reads of
/etc/shadowor a private key, and persistence written tocron, a systemd unit orauthorized_keys. On Windows: encoded or hidden PowerShell (T1059.001), fetch-and-run throughInvoke-Expression,certutil,bitsadminormshta(T1105), LSASS and SAM-hive credential theft (T1003.001), and persistence through Run keys (T1547.001), scheduled tasks (T1053.005) or service creation (T1543.003). Credential theft is flagged whoever runs it; persistence is flagged only when a network-facing service such as an IIS worker is the one doing it, because scheduling a task is otherwise ordinary administration.
End-of-Life Inventory
A CVE scan tells you which patches are missing. It cannot tell you that a host runs an operating system whose vendor stopped shipping patches eleven months ago — which is the more serious finding, because there is nothing left to patch. A daily read-only probe reports what each host actually runs, and the manager matches it against a bundled end-of-life dataset.
- What is checked: The distribution and version, kernel, OpenSSL, OpenSSH, Python, systemd, and any installed PostgreSQL, MySQL/MariaDB, Node.js, PHP, nginx or Apache. On Windows, the build and edition.
- Three verdicts:
supported,approaching(within 180 days of its end date) andeol. A host that crosses into end-of-life raises the Security: End-of-Life Software alarm through the normal incident and notification path, and it clears itself once the host is upgraded. - Silence is never a verdict: A component or version the dataset does not recognise produces no finding at all. “We do not know” is never rendered as “supported”, and even less as “end of life”.
- Works offline: The dataset ships with the release and is never fetched at runtime, so an on-premise manager needs no outbound access and does not phone home.
- Where to read it: Security → End-of-Life leads with the three counts and lists every finding ordered by the date support ends, with the host, the component, the version found and the days remaining. Clicking a count filters to it. The same posture is available as
GET /api/security/lifecycle. Both require the security-scanning permission, and the panel shows which dataset release answered you.
Configuration Drift
A fleet is only manageable while its members are alike. The host someone patched by hand at 2 a.m., or the one whose service was disabled “temporarily” two years ago, is what breaks the next rollout — and nothing notices, because each host looks perfectly healthy on its own. Drift is only visible by comparison, so each host is scored against the other members of its machine group.
- Consensus baseline by default: For every attribute, the baseline is whatever a majority of the group runs. That needs no curation, so it works on day one, and no single heavily-customised host can define what “normal” means. A group that wants to be explicit can instead pin a golden host.
- What is compared: Installed packages and their versions, enabled services, listening ports, the kernel and a few sysctl values — with a weighted score in which a missing package or a stopped service costs more than an extra one, because that is what actually breaks automation.
- Fingerprints only: The probe never reads file contents. Package names, service names, ports and versions — nothing else — so the feature stays inside the privacy boundary.
- Deliberately quiet where it should be: A group of fewer than three members has no baseline at all, because a “majority” of two means nothing. An even split asserts nothing rather than picking a side. And the kernel is compared on its release line, so the first host to take a routine security update is not flagged for it.
- Where to read it: Security → Drift lists the fleet worst-first with each host's score, its machine group and whether the baseline came from consensus or a pinned host. Opening a row shows the actual differences — which packages are missing or the wrong version, which services are stopped, which ports are open that the group's other members do not have, and which sysctl values differ — because a score tells you something is wrong but not what to go and fix. Crossing the threshold raises System: Configuration Drift, and the same data is available as
GET /api/security/drift. Both require the security-scanning permission.
Incident Correlation & Postmortems
An incident is opened per check and host, so a single sick machine with ten failing checks used to page ten times, and one bad change that broke the same check fleet-wide paged once per node. That is the fastest route to operators muting the channel, so related symptoms are now grouped under the incident that already paged.
- Three grouping rules, no AI in the notification path: Three or more different checks failing on one host within five minutes are one degraded host; the same check failing on three or more hosts is one common cause; and a check that flips state six or more times in thirty minutes is throttled so a marginal threshold cannot page all night.
- Two guarantees: The first page for a cause is never suppressed, and recovery notifications are always delivered — an operator must always learn that something came back.
- Security is never grouped away: Security findings and certificate expiry always page on their own, so no burst of unrelated failures can hide a file-integrity change.
- Postmortems: Writing one means reconstructing what happened, and the system already holds every piece — the check history, the commands anyone ran on the host, the remediations that fired, the security events and the telemetry around the window. That timeline is assembled deterministically; the AI is then asked only for the summary, probable cause and follow-up actions. If the model is unavailable the timeline is still stored and rendered, because the deterministic half is what makes it worth keeping.
- Credentials never reach the model: Passwords, tokens, bearer headers, connection strings and private keys are masked out of command lines, check output and operator comments before anything is sent or stored.
API Keys & Metrics Export
Enterprises will not replace their existing observability stack, and they should not have to. Scoped API keys let a machine caller read a single organization's data, and the metrics can be pulled or pushed into whatever already runs.
- Scoped keys: A key is created with an explicit scope list (
read:agents,read:telemetry,read:security,read:metrics), an optional expiry and immediate revocation. The secret is shown once, at creation, and only its hash is stored — so a database leak yields nothing usable. - A machine caller is not an admin: An API key resolves to its own identity, never to a human session, so it can never inherit a person's implicit access. Unknown, revoked and expired keys are rejected identically.
- Prometheus / OpenMetrics:
GET /api/metricsexposes agents, per-node CPU and memory, open incidents and unhandled threat alerts for the key's organization, with a hard cap on series per tenant. - OTLP push for those who cannot scrape: Where the manager sits behind a firewall, it can instead push the same metrics to an OTLP collector you nominate. The endpoint is re-validated on every send (DNS can be repointed after it was saved) and the collector's credentials are encrypted at rest and never returned by the API.
Command Confinement
The agent executes administrator-supplied commands as root. Two optional, agent-local controls narrow what those commands can do. Both are configured on the host itself — nothing is pushed from, or reported to, the manager.
- Run as another user (
AI_LINUX_SANDBOX_RUNAS): commands execute as the configured account. This is fail-closed — if the user does not exist the command is refused rather than quietly running as root. - Syscall filtering (
AI_LINUX_SANDBOX_SECCOMP, Linux x86-64): blocks kernel module loading,kexec,ptrace, cross-process memory writes and raw I/O port access — things a management agent never needs and an attacker who reaches command execution always wants. A blocked call fails with a clear error rather than the process vanishing. - What it is not: This is defence in depth, not a jail.
mount,unshare,bpfandperfstay available on purpose, because a sysadmin agent legitimately needs them and a sandbox that breaks real remediation work gets switched off. Approval workflows remain the real control.
Ansible Automation
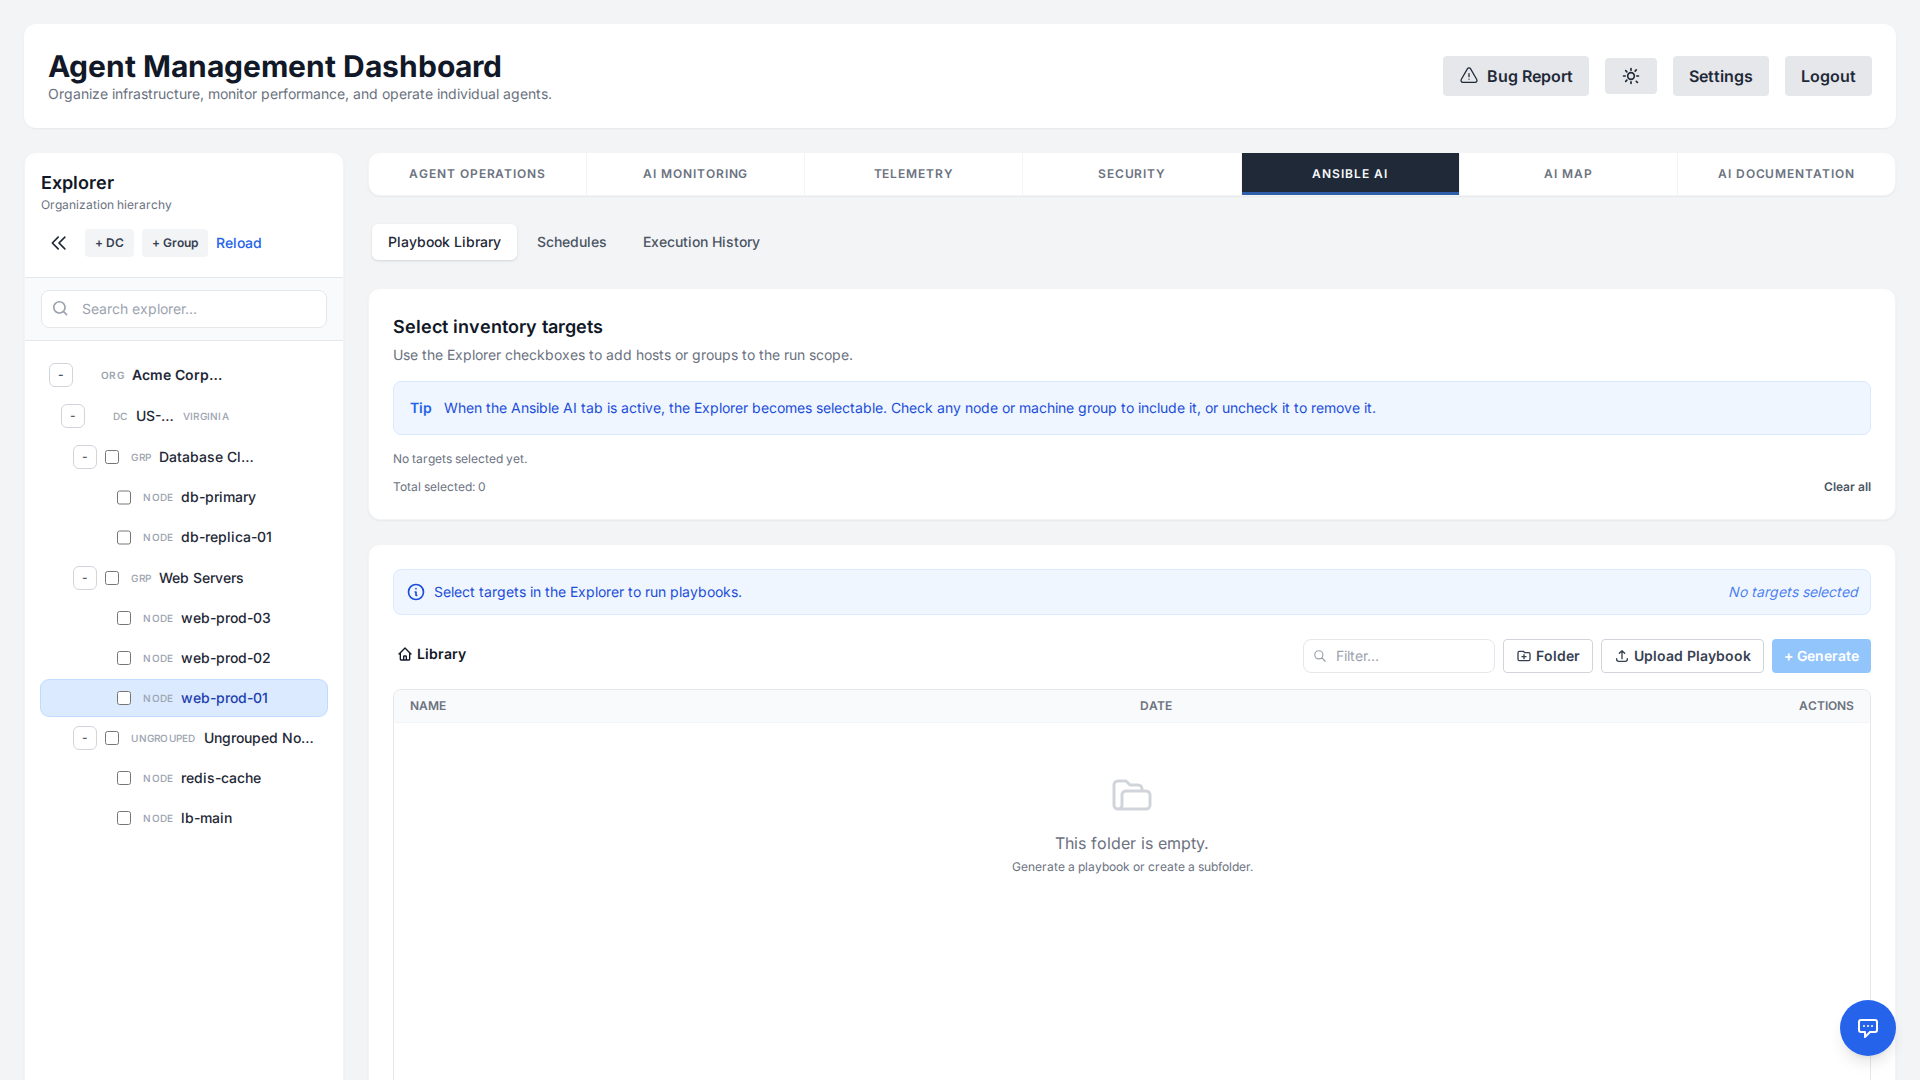
Generate Ansible playbooks for complex deployments. The AI ensures idempotency, follows best practices, and correctly targets winrm or ssh connections based on the operating system.
Terraform Provisioning
The Terraform tab of IaC AI turns a plain-English objective into production-ready Terraform (HCL) for the major clouds — AWS, GCP, Azure, and VMware. Describe what you want to provision and the AI writes the configuration, declaring proper variable blocks for anything it can't safely guess (AMI id, region, VPC/subnet, instance size, SSH key, …).
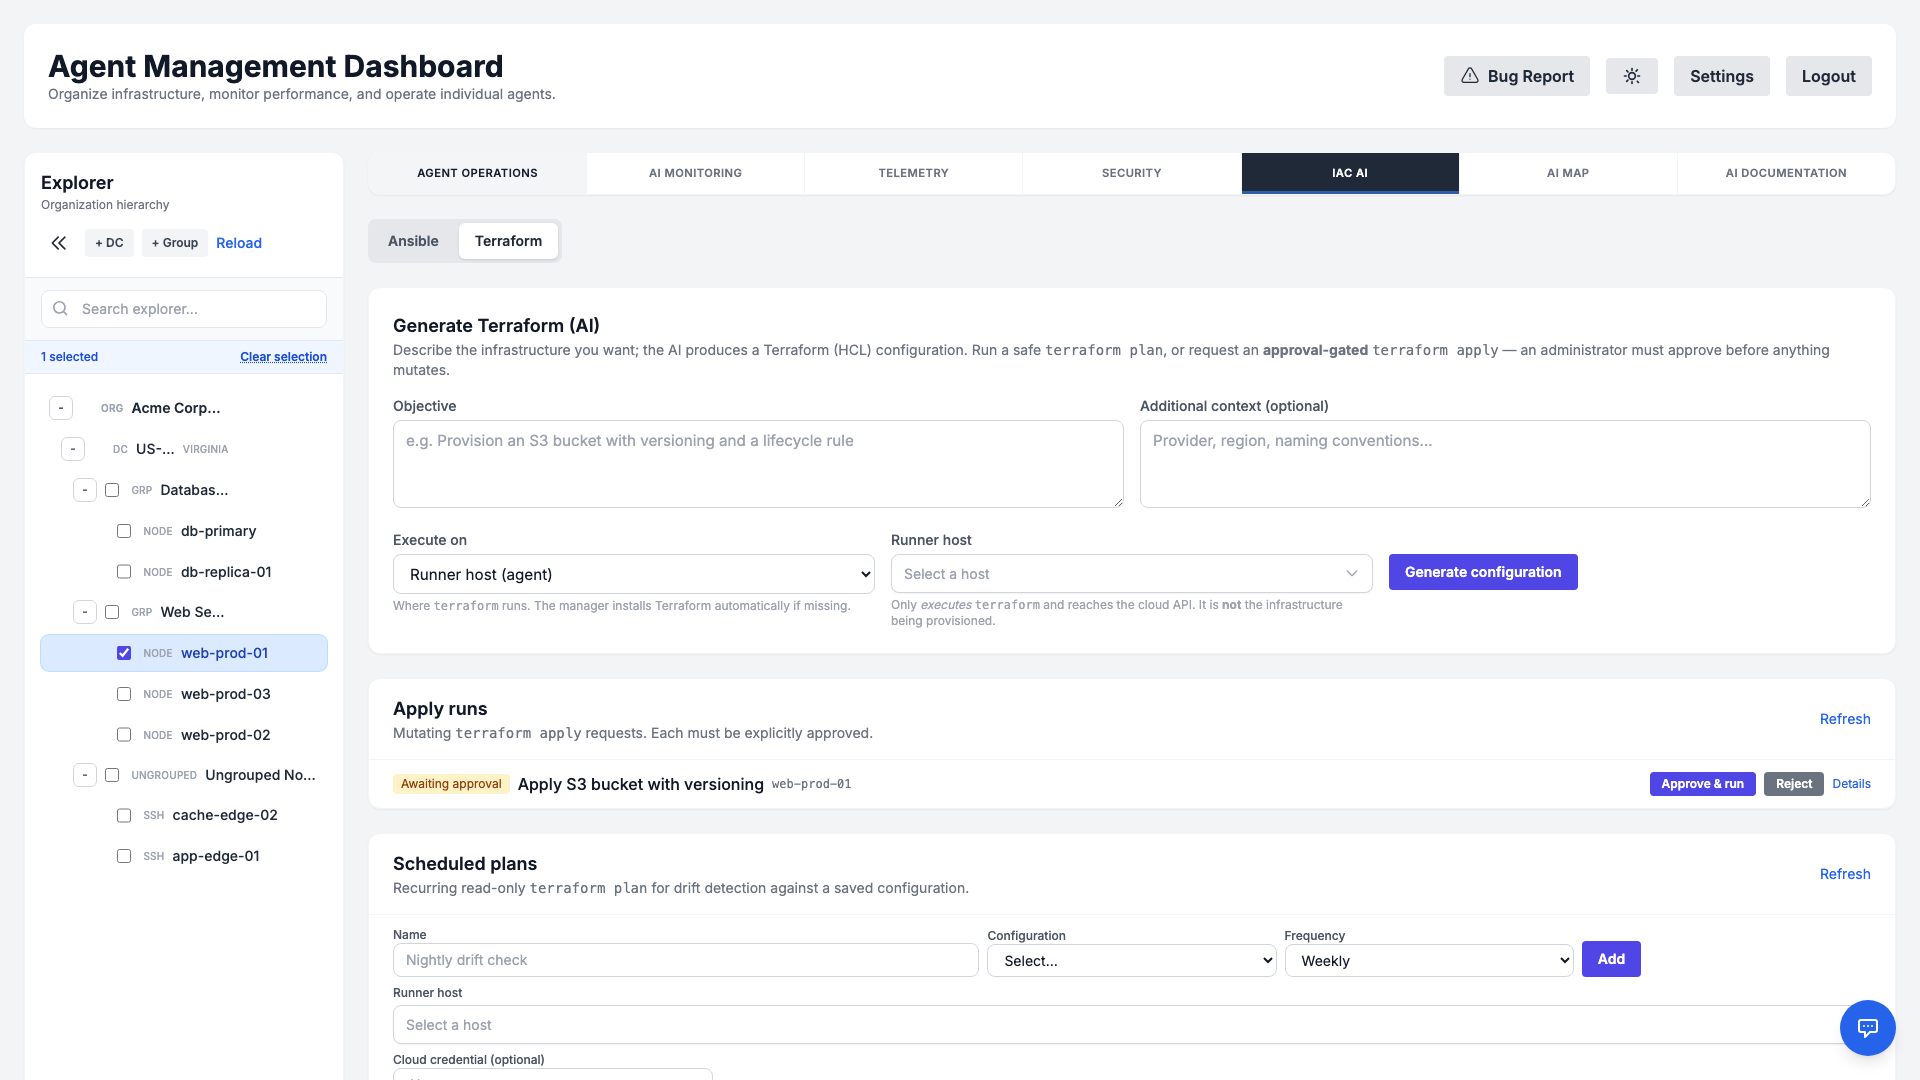
Iterative generate → validate → refine loop
Just like testing a monitoring check before saving it, you can iterate on a configuration before anything is applied:
- Required inputs form: Values the AI can't know are surfaced as a structured form you fill in, rather than guesswork or placeholder
terraform.tfvars. Apply inputs & regenerate bakes them into the configuration. - Validate (test): A fast, credential-free
terraform validatechecks config and schema correctness — no cloud API calls and no state changes. - Refine with AI: Describe a change in plain language (“add a lifecycle rule”, “change the region”) and the AI rewrites the current HCL in place.
Plan, and approval-gated apply
Run a safe, read-only terraform plan to preview changes at any time. A mutating terraform apply is approval-gated — it is submitted as a request that an administrator must explicitly approve before anything is created, changed, or destroyed. Recurring scheduled plans can run automatically for drift detection against a saved configuration.
Runner & cloud credentials
- Flexible runner: Choose Manager (this server) or a runner host to execute
terraform. The runner only runs Terraform and reaches the cloud API — it is never the infrastructure being provisioned. Ifterraformisn't installed, the runner downloads a pinned, checksum-verified release on demand. - Encrypted credential vault: Per-organization cloud credential sets (AWS/GCP/Azure/VMware) are stored encrypted, injected into a run only as ephemeral environment variables, and never written to command history, logs, or generated HCL. Secret values are write-only — the UI shows only variable names.
- Configuration library: Save, organize (in folders), and reuse generated configurations per organization.
AI Map
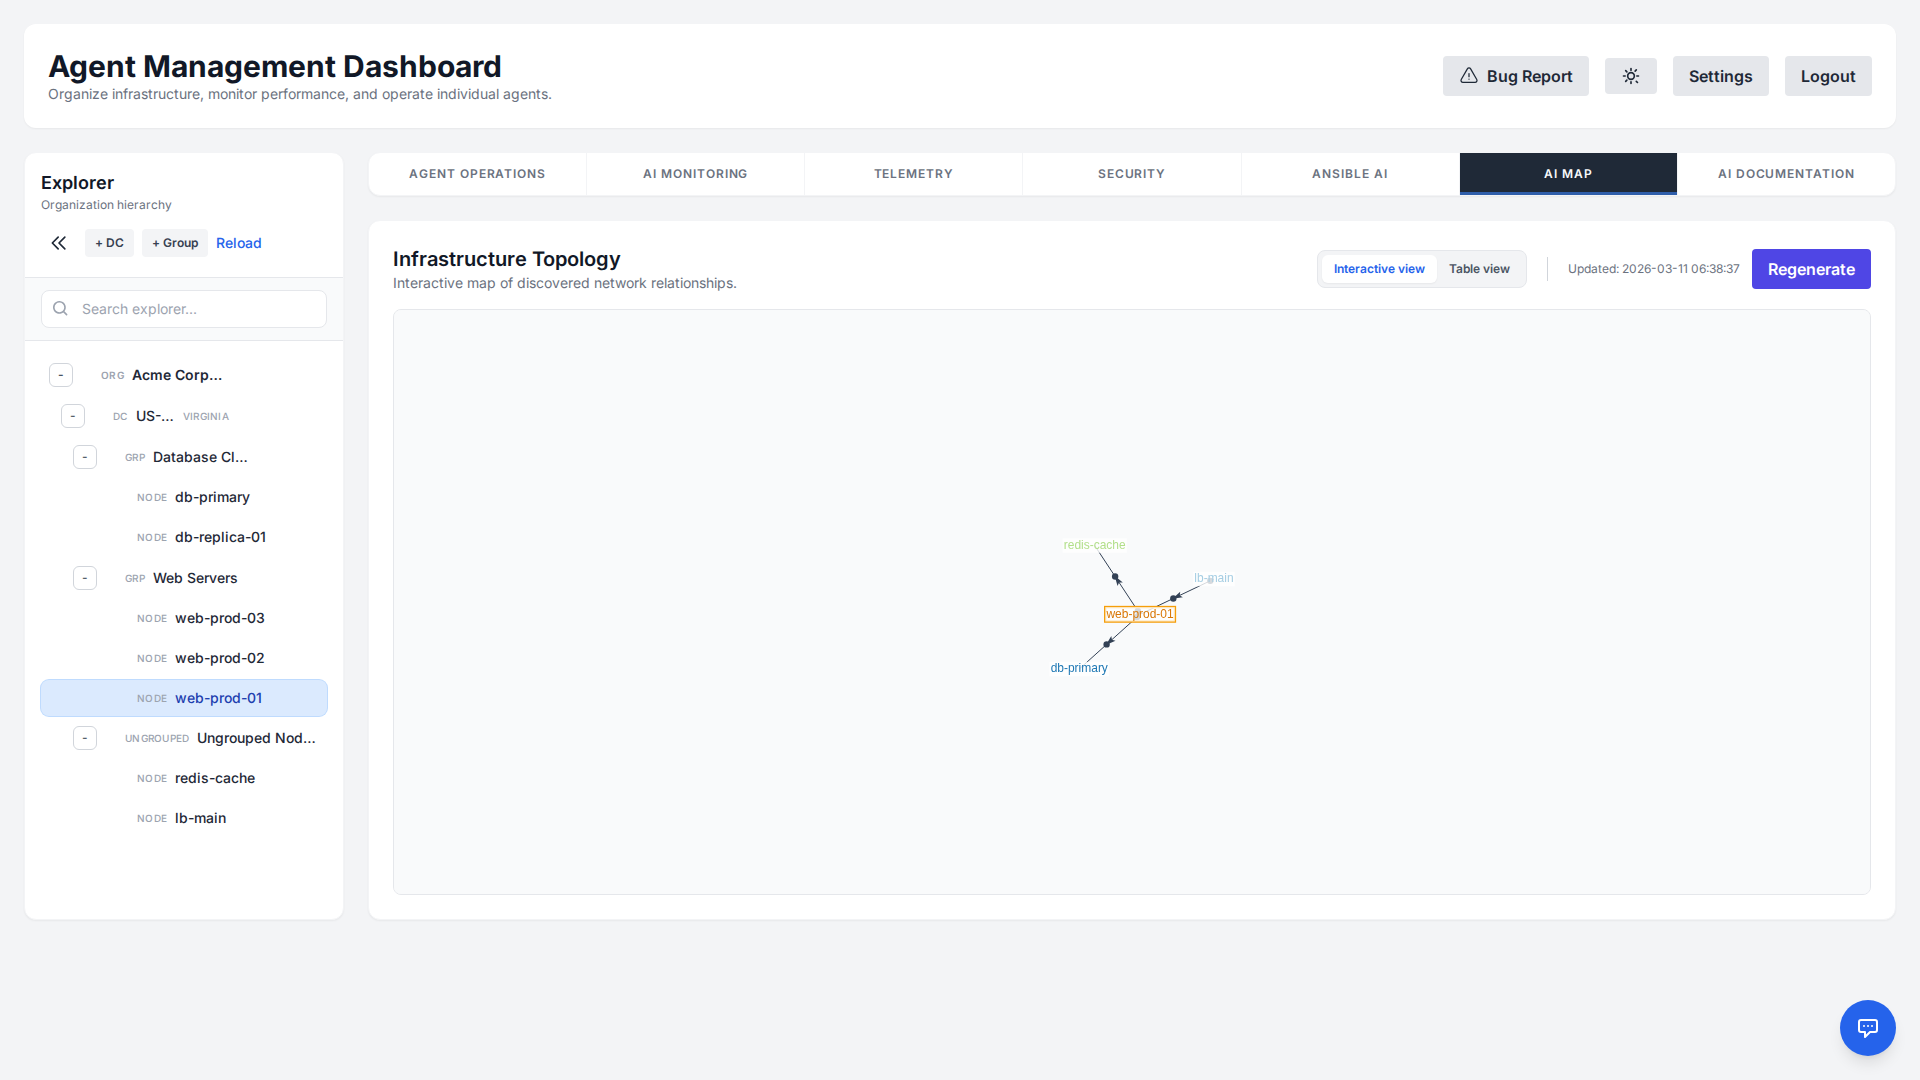
Visualize your entire infrastructure topology in real-time. The AI Map provides an interactive graph view of all connected nodes, their relationships, and current status, allowing for quick identification of network bottlenecks and structural dependencies.
AI Documentation
Keep your infrastructure documentation in sync with reality. The AI Documentation feature automatically discovers installed packages, network configurations, running services, and more.
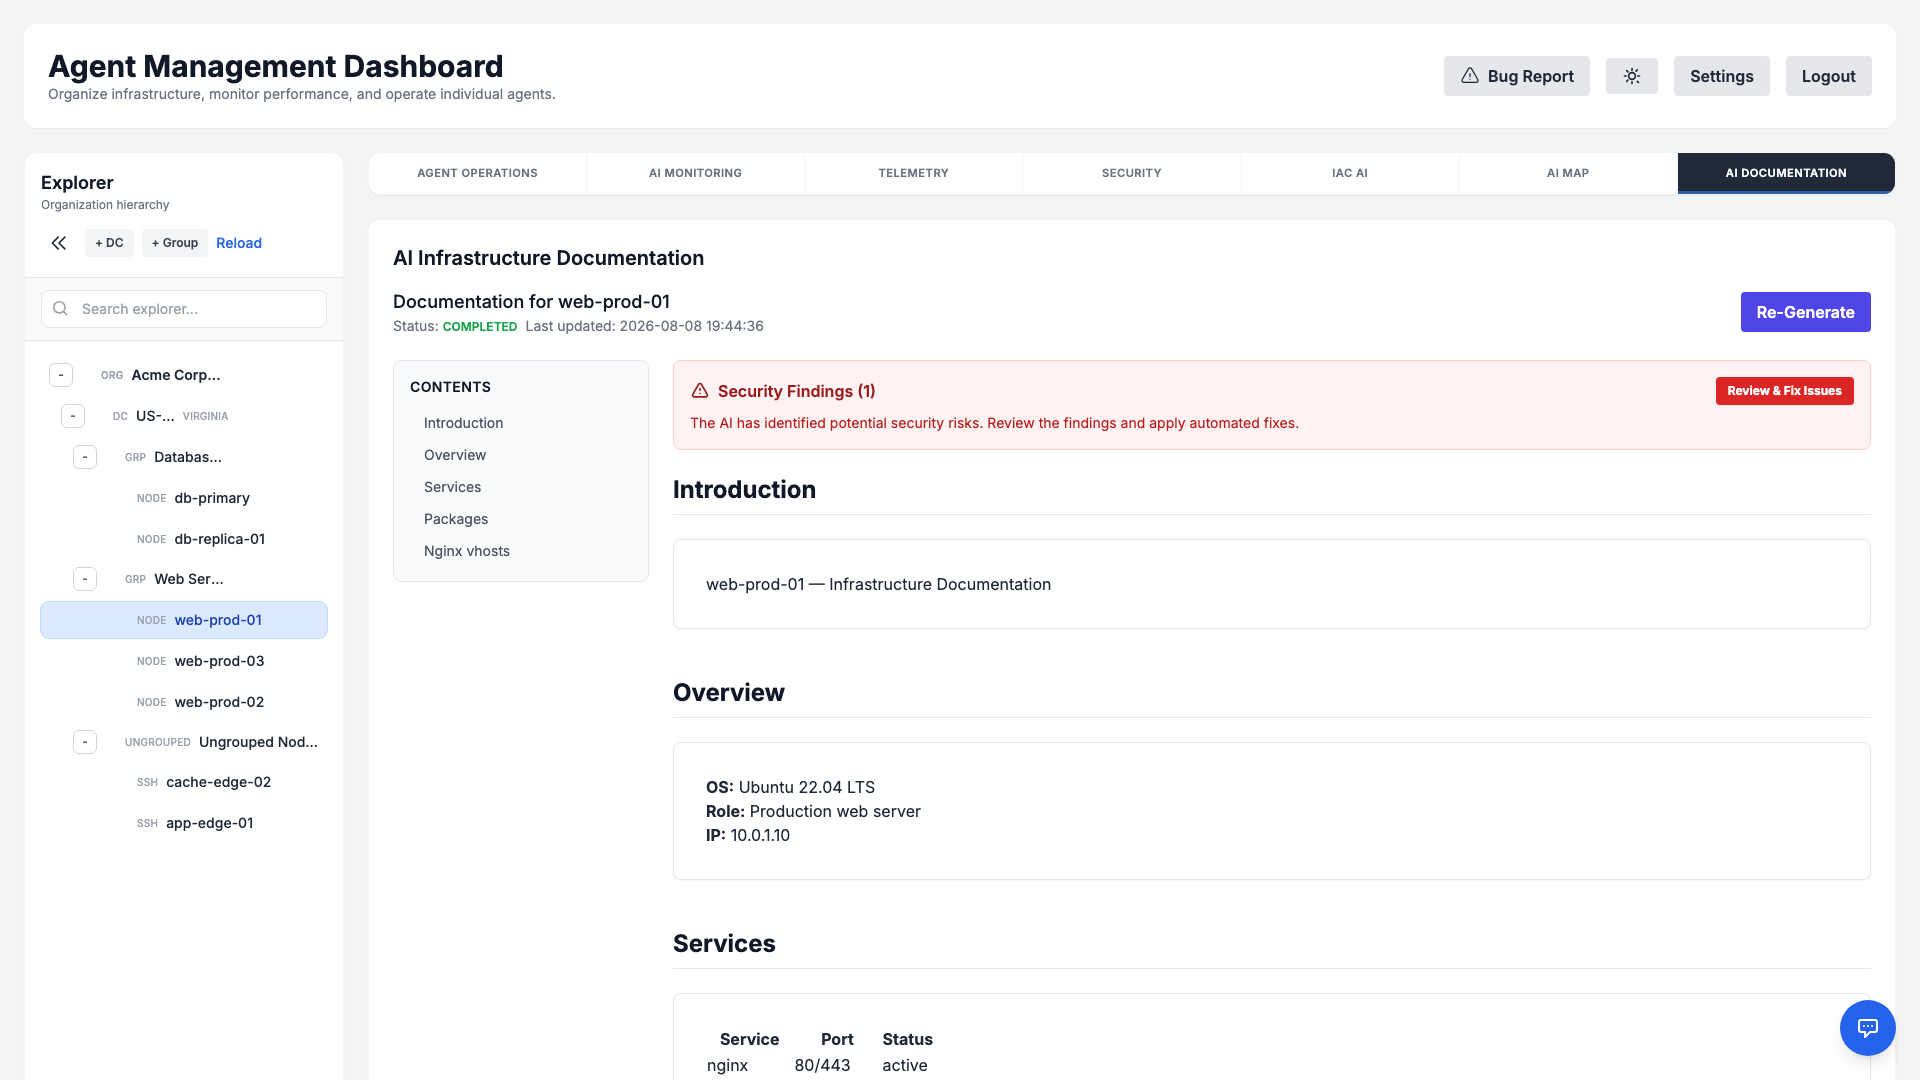
It then synthesizes this raw data into a structured, easy-to-read Markdown document, covering everything from OS details to IIS/Nginx vhost configurations. You can view, export, or regenerate this documentation directly from the dashboard to ensure you always have an up-to-date reference.
AI Knowledge
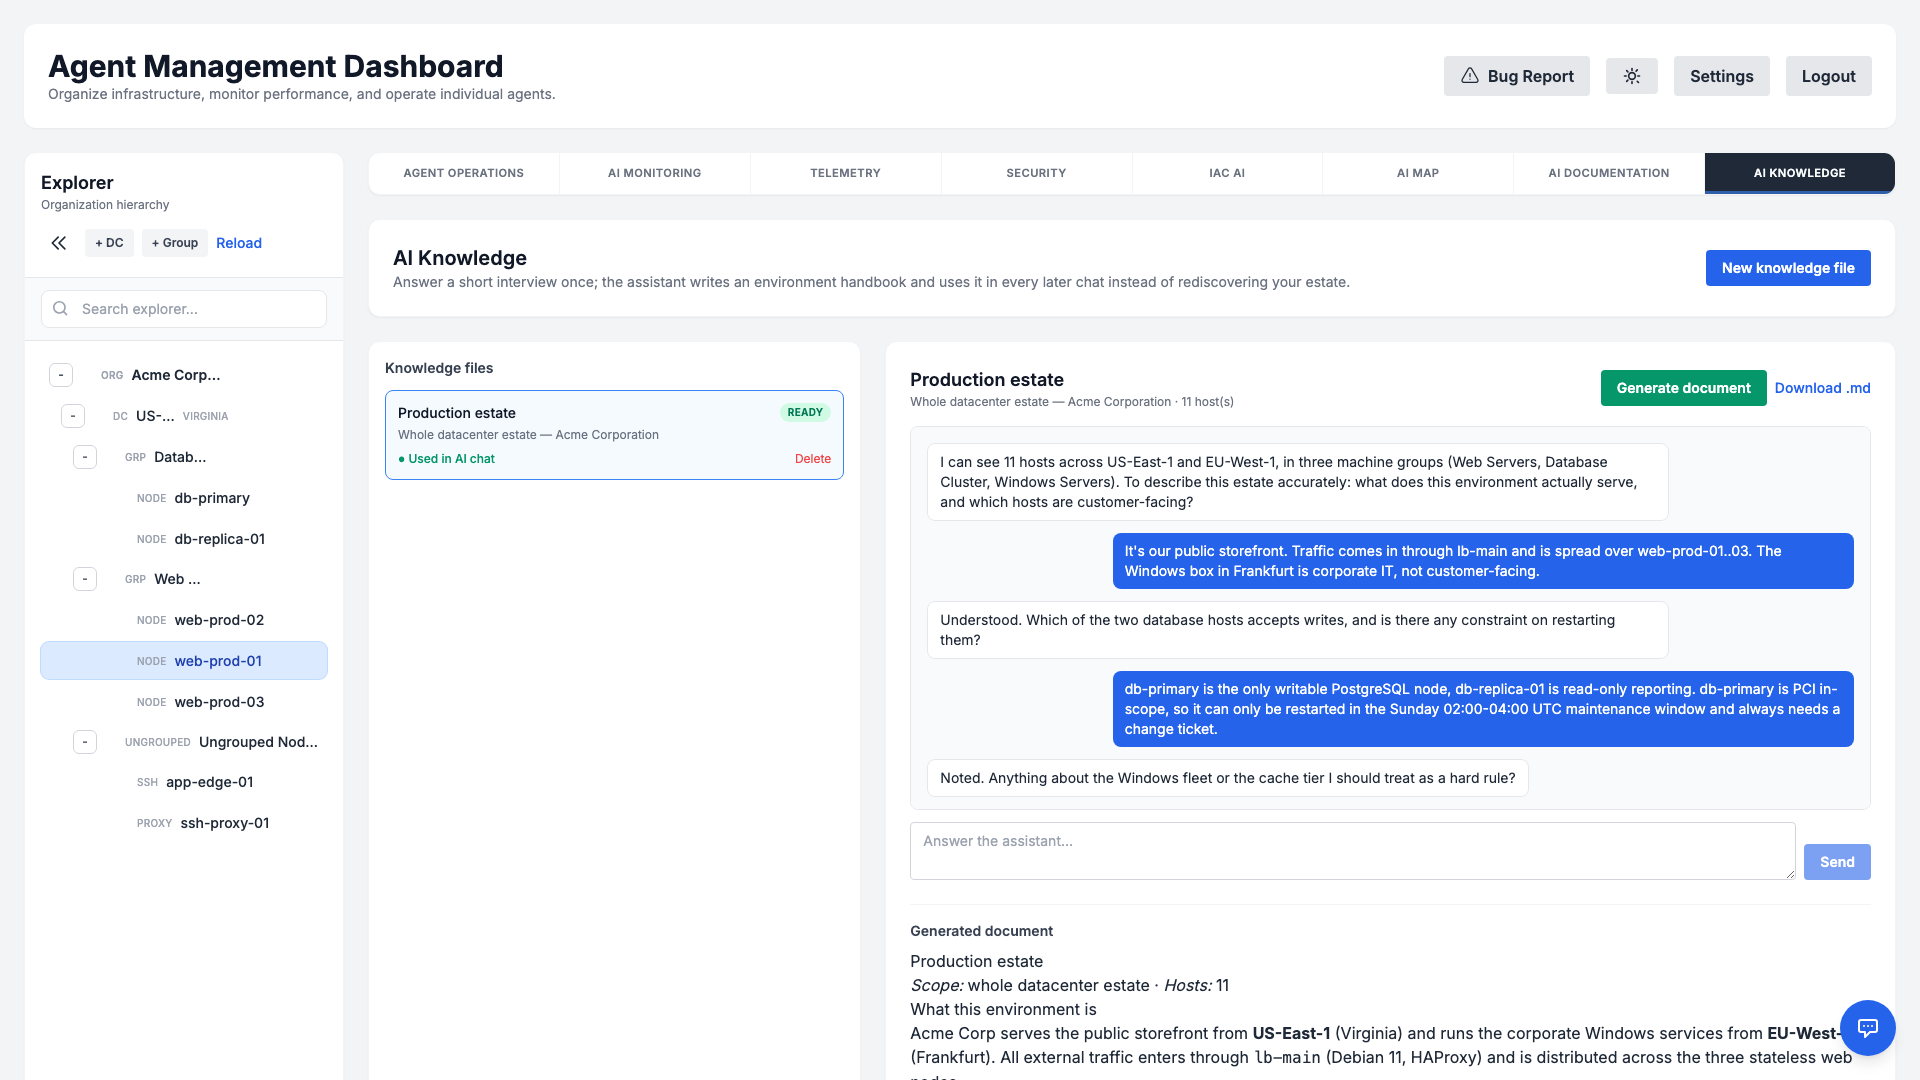
The manager already knows the facts about your estate: which hosts exist, what they run, which datacenter, group and tags they carry. What it cannot infer is the intent — which host is the primary database, which nightly window is sacred, which service must never be restarted during business hours. Without that, every chat starts from zero and you end up retyping the same context.
A knowledge file captures it once. Open the AI Knowledge tab, click New knowledge file and choose what it covers.
Choosing a scope
A file can describe the whole datacenter estate, specific datacenters, specific machine groups, a set of tags, or named servers. Scoping by tag is often the most useful: one file can describe every database host wherever it lives.
The interview
The assistant starts from what the platform has already discovered about the hosts in scope: the services and listening ports from the configuration fingerprint, the containers running on them, the certificate names they serve, anything out of support, and the “Software & Services” section of their AI Documentation. So it does not ask what a host runs — it asks what that means: “I can see MySQL listening on 3306 on db-01 — is that the production customer database, and who depends on it?”
From there it works through a fixed plan of nine topics — purpose, criticality, maintenance windows, dependencies, ownership, what must never be touched automatically, where the data lives, what warrants waking a human, and network constraints. One question per topic, in your language. Because the running order is fixed and owned by the manager rather than chosen by the model, the interview cannot loop back onto a topic it has already covered, and it always ends: the counter under the transcript shows which question you are on. Say “that's everything” at any point to stop early.
If a host has no AI Documentation yet, the questions about it stay more general — the panel tells you how many hosts are in that state so you can generate it first. Documentation is never generated automatically, because it requires the agent to be online and spends tokens per host.
On secrets: AI Documentation is built from a probe that reads web-server and cron configuration, so its text can contain credentials. Anything the knowledge base borrows from it is passed through the same redaction used for incident postmortems — passwords in connection strings, -p flags, API keys and private-key blocks are masked before they reach the model or the stored document.
The document
Generating merges the machine-collected inventory with your answers into a Markdown handbook: a summary, the datacenter/group/tag breakdown, the operating rules the assistant must respect, and per-host notes. If a host is named in the write-up that is not in the collected inventory, it is dropped — a handbook that confidently describes a machine which does not exist is worse than one that stays silent.
Editing it by hand
The document is plain Markdown and you own it. Edit Markdown opens the raw text in an editor; what you save is stored verbatim and is exactly what the assistant reads — there is no second interpretation step. Use it to correct a detail the interview got wrong, to add a section the plan never asked about, or to skip the interview entirely and write the handbook yourself (Write it manually on an empty file). Download .md exports the same text, so a file can be kept in Git and pasted back after review.
One caveat: pressing Generate document again re-runs the model and overwrites the whole document, manual edits included — the dashboard asks for confirmation first. Edit after generating, not before.
How it is used
Every knowledge file marked Used in AI chat is supplied to the assistant as background on later questions, so it starts already oriented instead of rediscovering the environment. The text is inserted into the chat prompt as delimited reference material, and only the files whose scope covers the hosts a question is about are included, with an overall size cap. Toggle a file off to keep it as a reference document without feeding it to the model. Knowledge never widens what the assistant is allowed to read, and it cannot bypass the approval step that guards command execution.
Notifications
Route alerts to wherever your team already works. From Settings → Notifications you can enable and configure multiple delivery channels, each toggled independently.
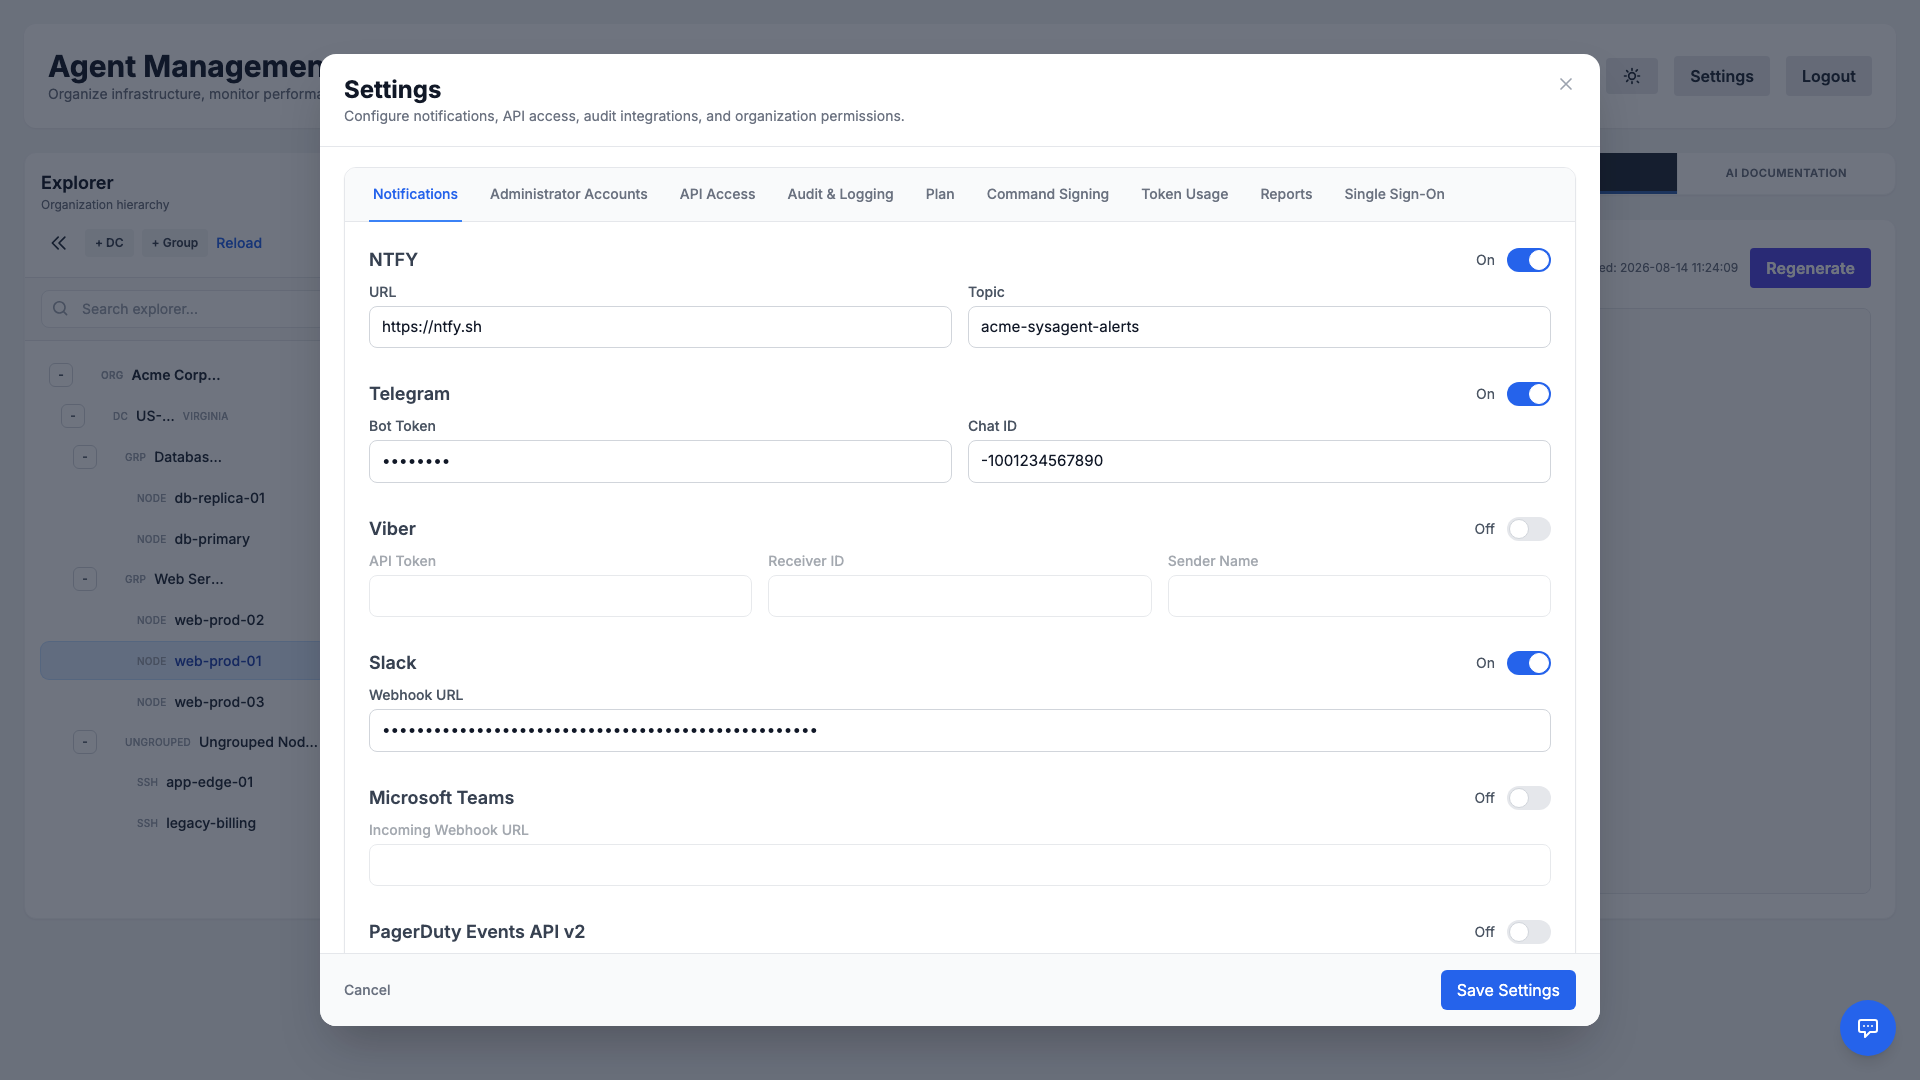
- ntfy: Lightweight push notifications via a topic URL (defaults to
https://ntfy.sh). - Telegram: Deliver alerts to a chat using a bot token and chat ID.
- Viber: Send alerts via an API token, receiver ID, and sender name.
- Slack: Post to a channel through an incoming webhook URL.
- Microsoft Teams: Post to a channel through an incoming webhook URL.
- PagerDuty: Trigger incidents through the Events API v2 using an integration key.
- Generic Webhook: POST a structured JSON payload to any HTTP endpoint, with optional custom headers, for custom integrations and chatops.
Each channel can be enabled and configured independently, and they integrate with on-call schedules and escalation rules so the right people are reached through the right channel.
RBAC & Permissions
Fine-grained Role-Based Access Control lets master administrators define exactly what each role can do. The Organization Permissions tab exposes a permission matrix covering every major function of the platform.
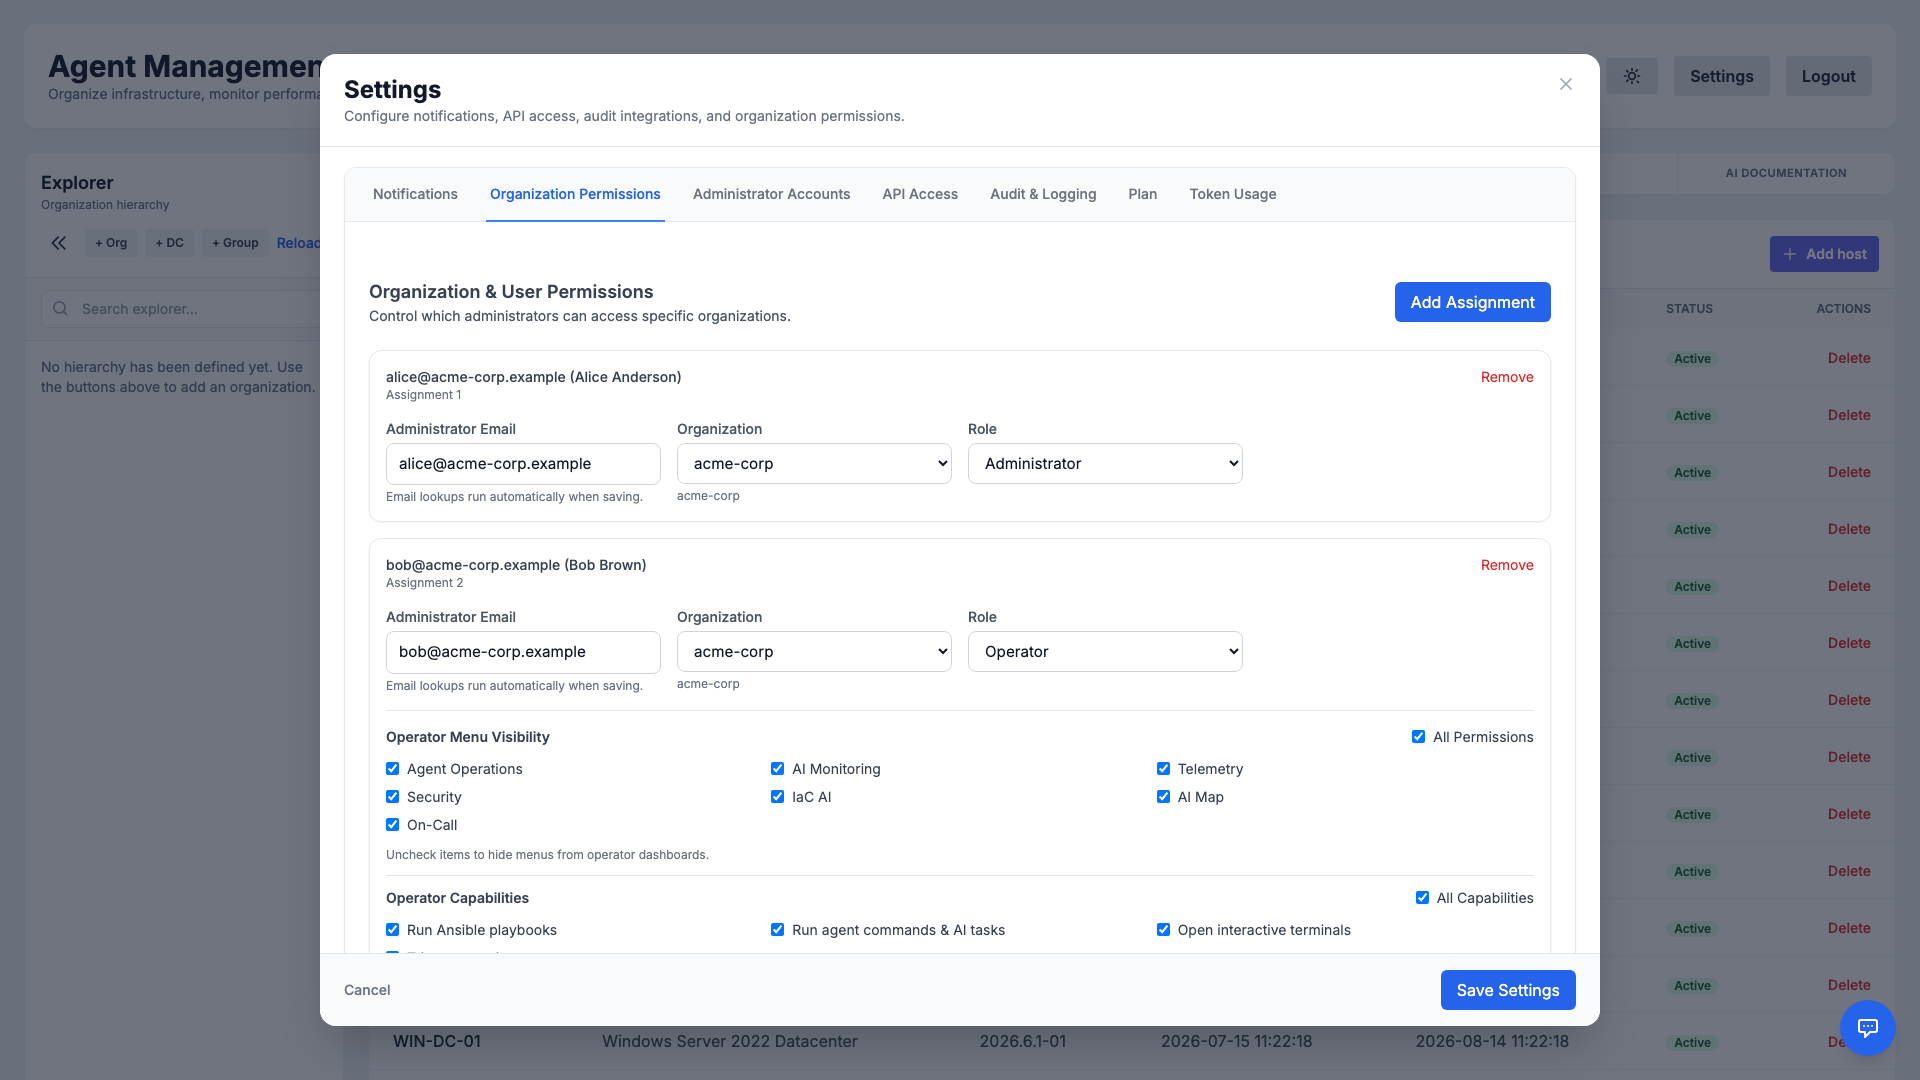
- Granular control: Toggle access to features such as command execution, remediation, security scanning, and settings.
- Least privilege: Give operators only the permissions they need, reducing the blast radius of any single account.
- Consistent enforcement: The same rules apply whether a user works in the UI or via the API.
Administrator Accounts
Manage the people who can access your organization from Settings → Administrator Accounts. Invite teammates, assign roles, and review existing administrators in one place.
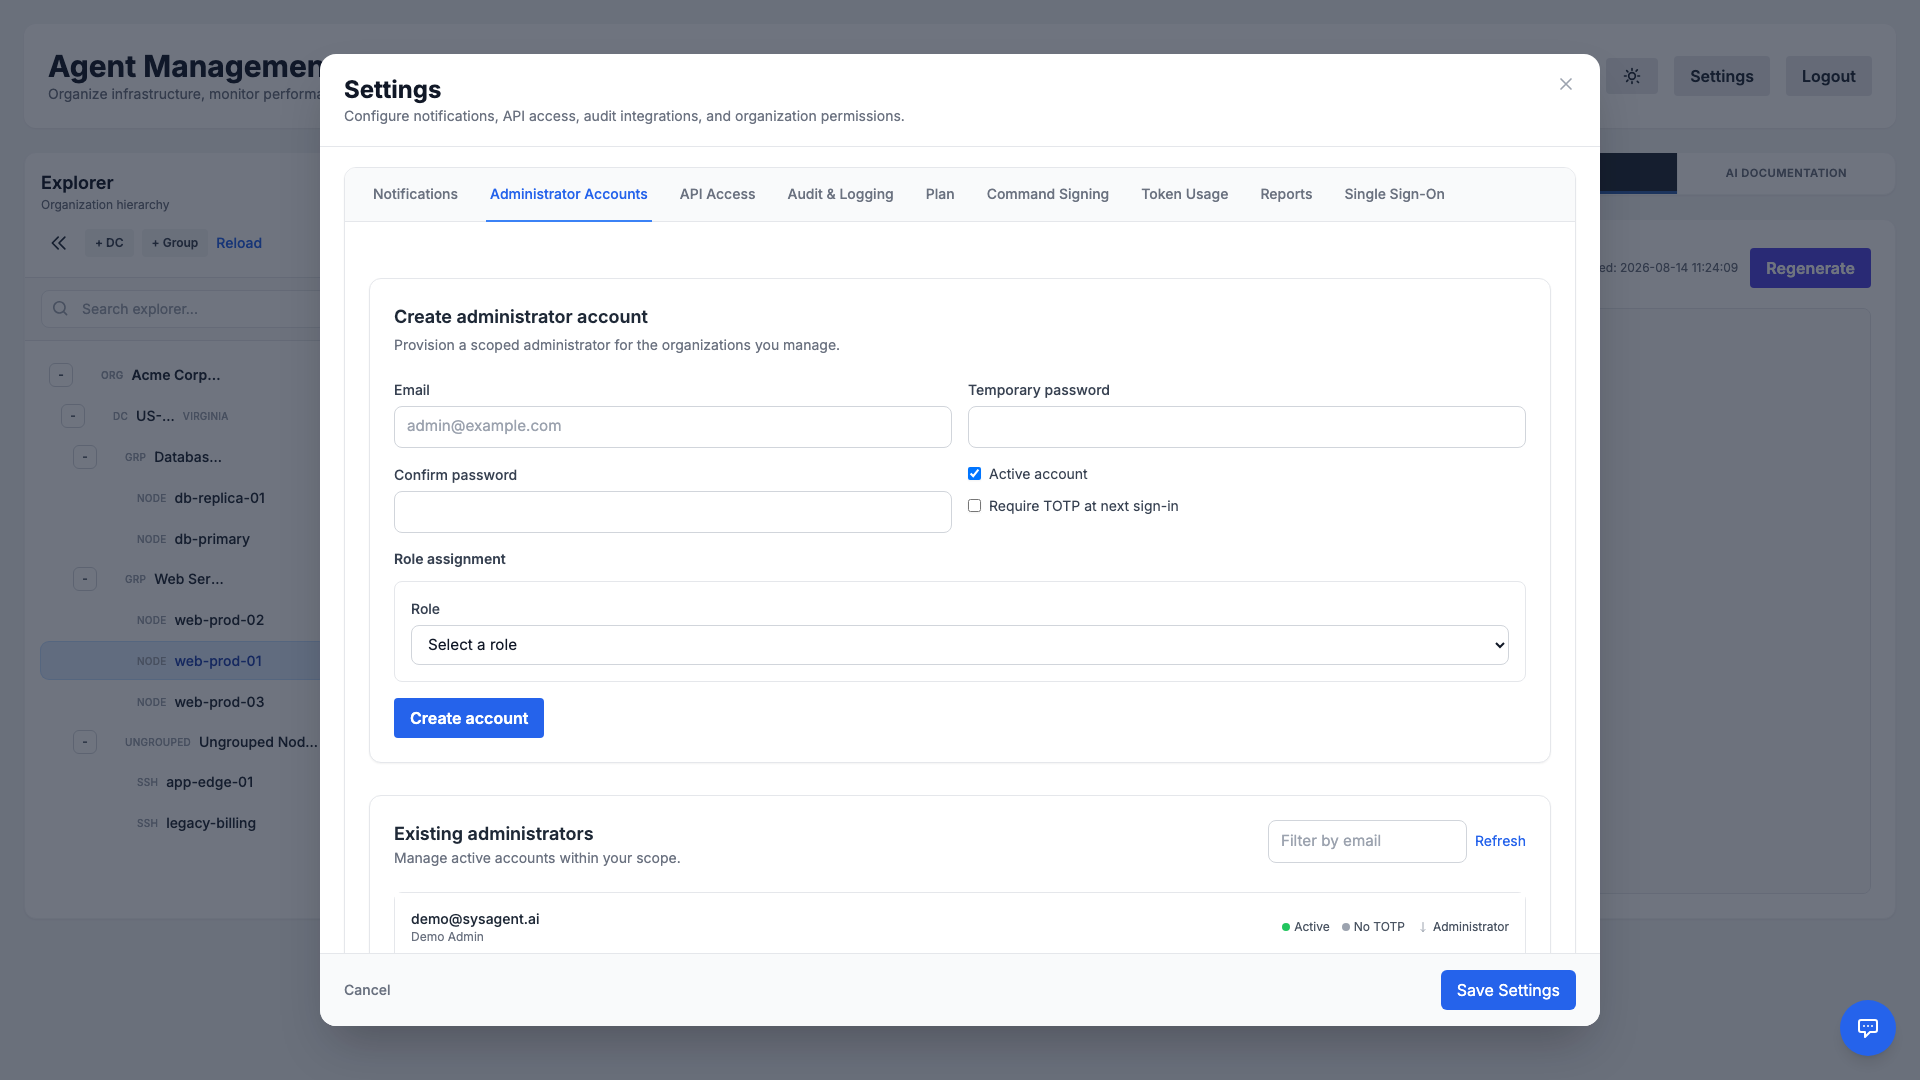
Each account can be granted a specific role — from full master administrator to a scoped operator — with permissions enforced consistently across the dashboard and API.
Audit Log
Maintain a complete, tamper-evident record of activity across your organization. The Audit & Logging tab captures who did what and when — from logins and command executions to configuration changes.
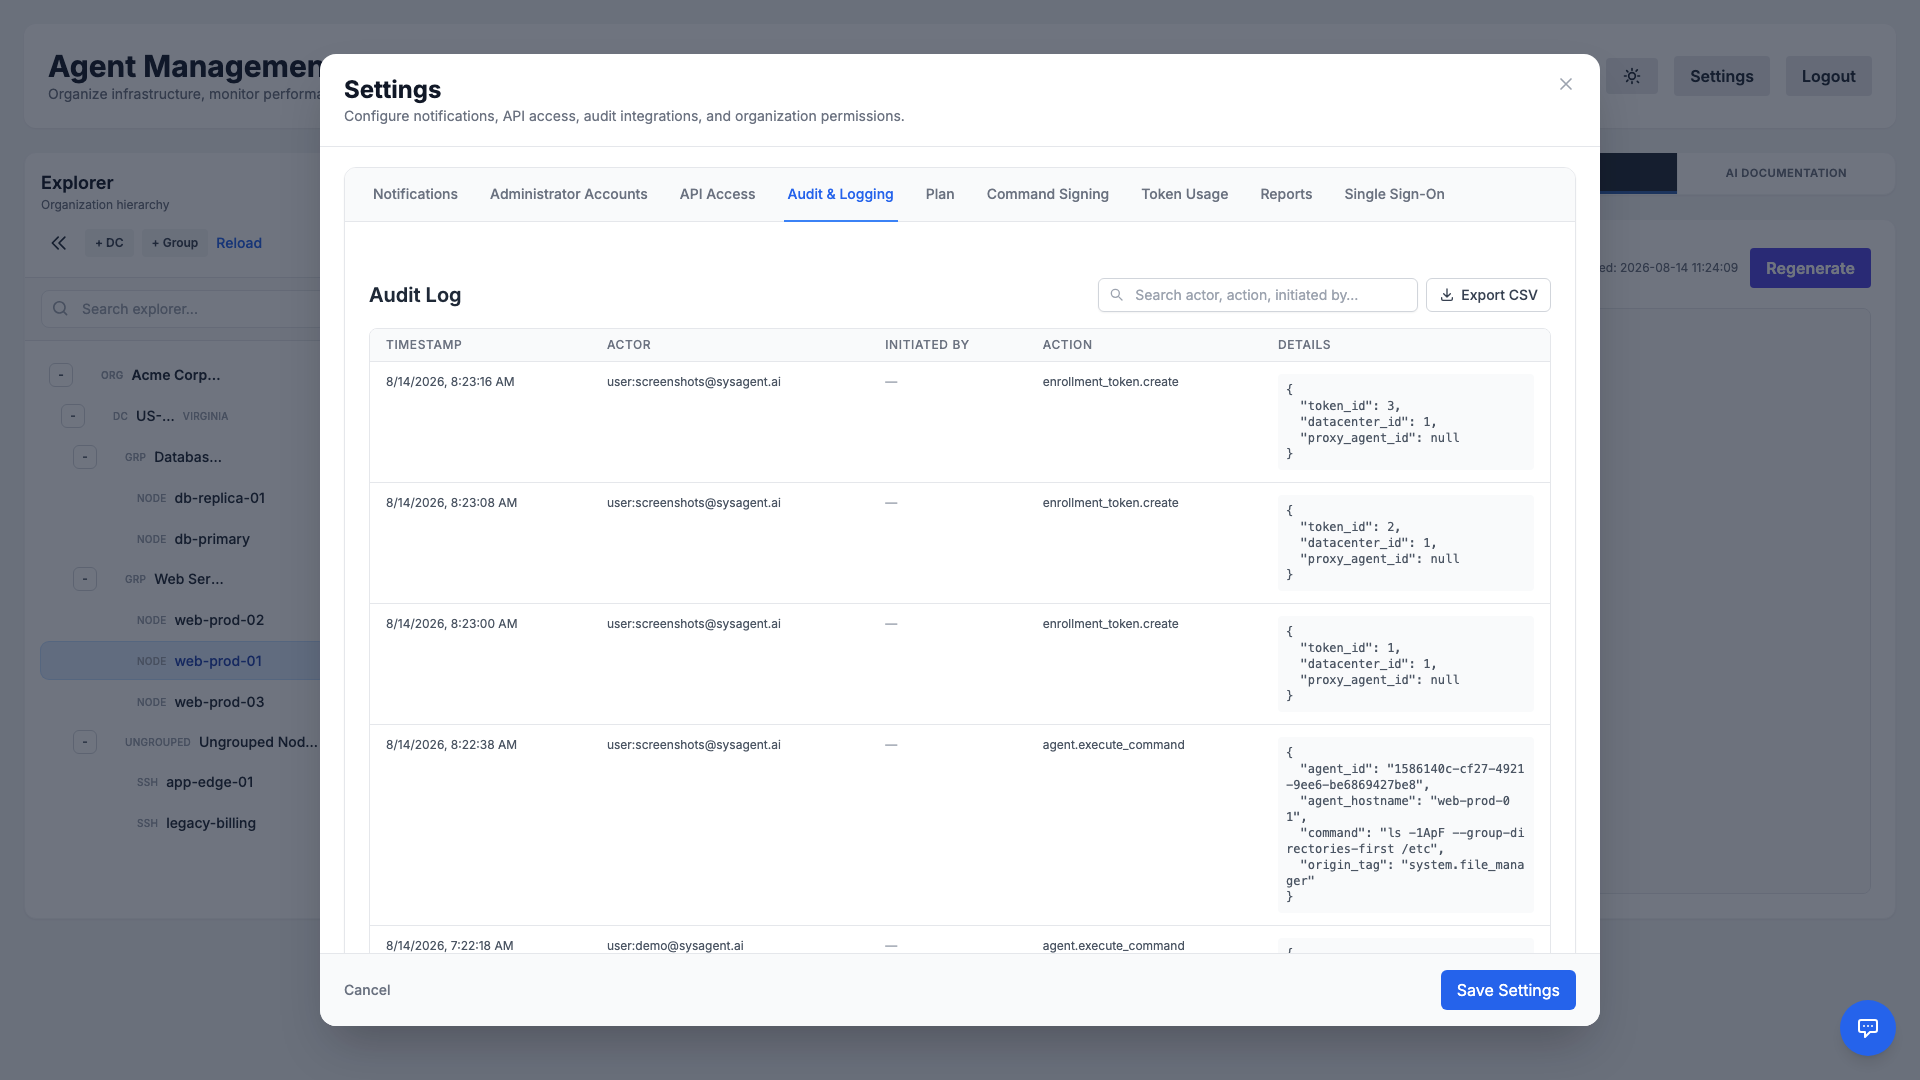
Audit events can also be forwarded to an external SIEM, helping you meet compliance requirements and investigate incidents with confidence.
Bring Your Own Key (BYOK)
For maximum privacy and scale, you can use your own AI provider API key (e.g., OpenRouter, OpenAI).
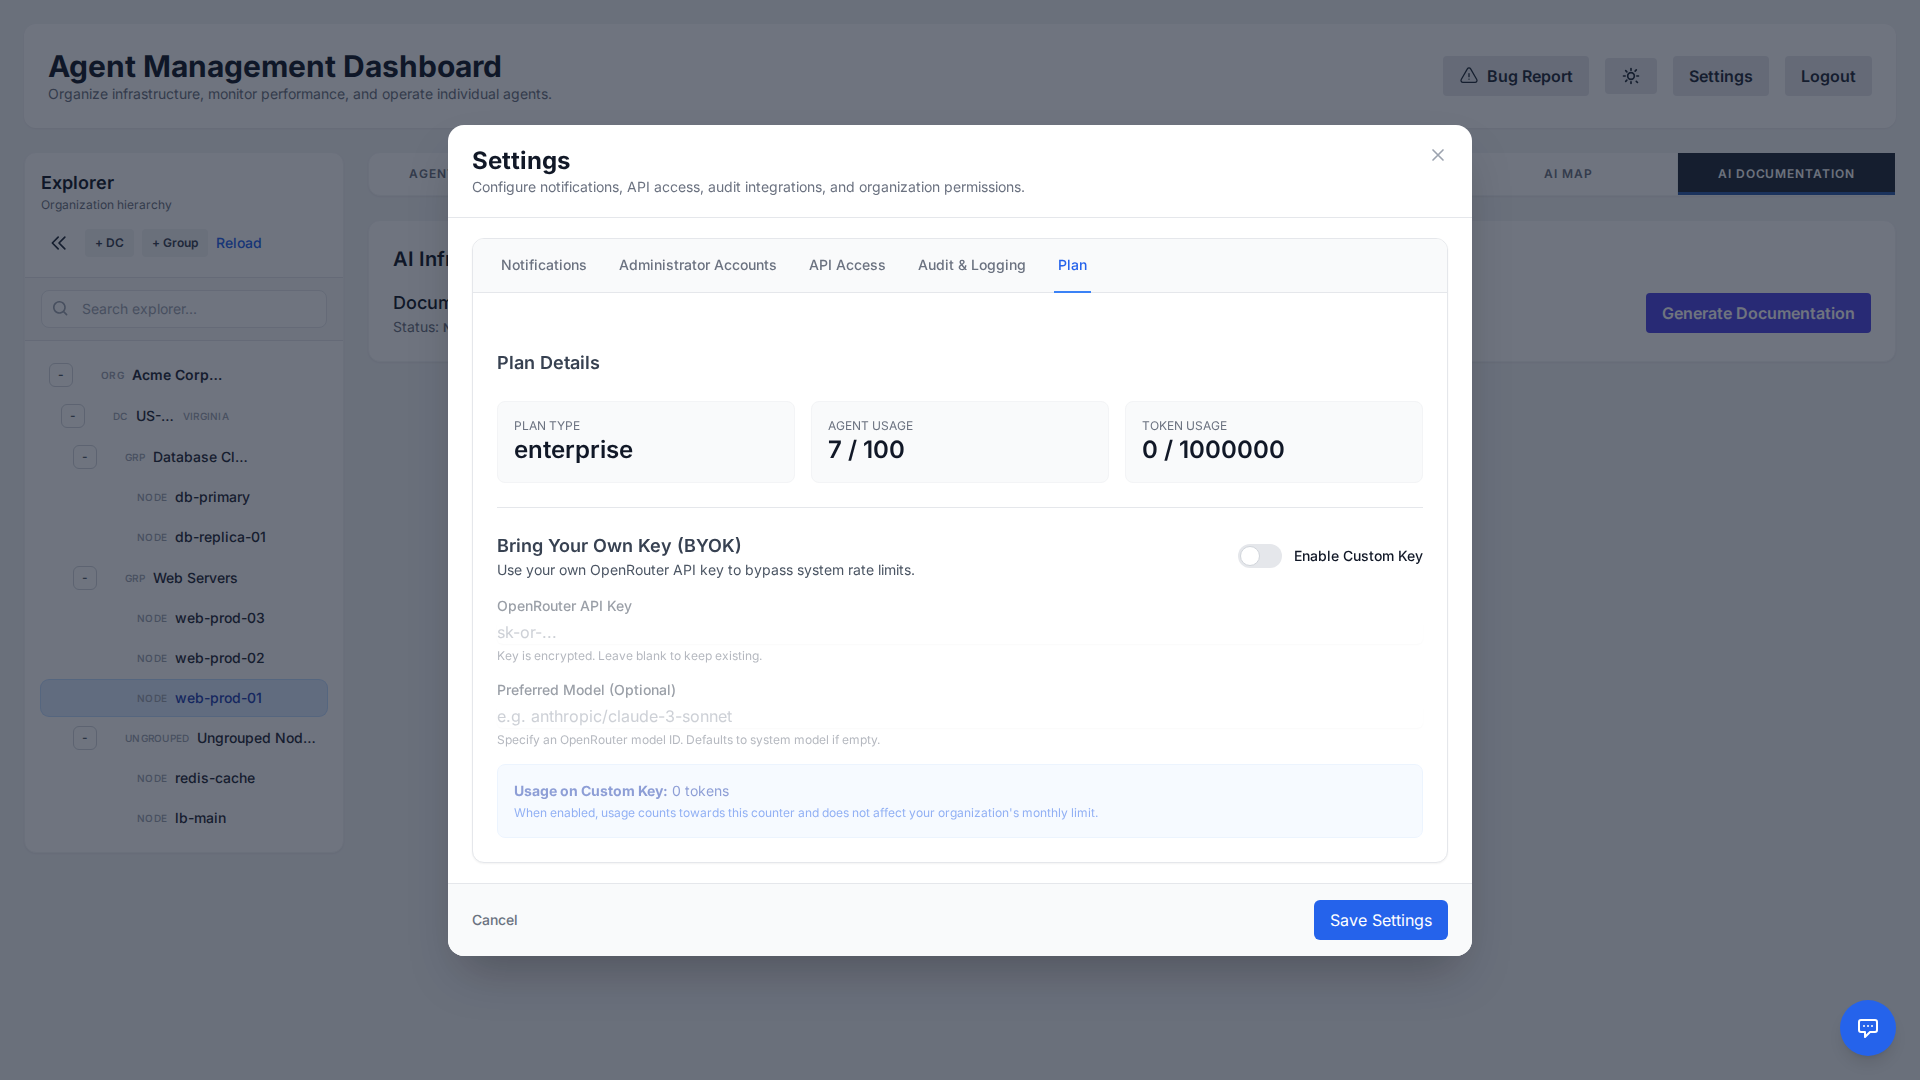
This ensures that:
- Usage is billed directly to your account.
- You get unlimited tokens on our platform (no longer bound by the Free Tier token limit).
- You can use custom models not provided in the default tier.
The key is encrypted at rest using AES encryption before being stored in the database.
Local LLM Backend
For maximum data privacy, you can run AI inference on your own OpenAI-compatible model (Ollama, LM Studio, vLLM, LocalAI, llama.cpp) instead of the cloud. With the Local LLM via agent backend, the manager never connects to — or even stores the address of — your model: it dispatches the request down the existing agent connection, and an LLM-capable agent sitting next to your model serves it. Prompts never leave your network.
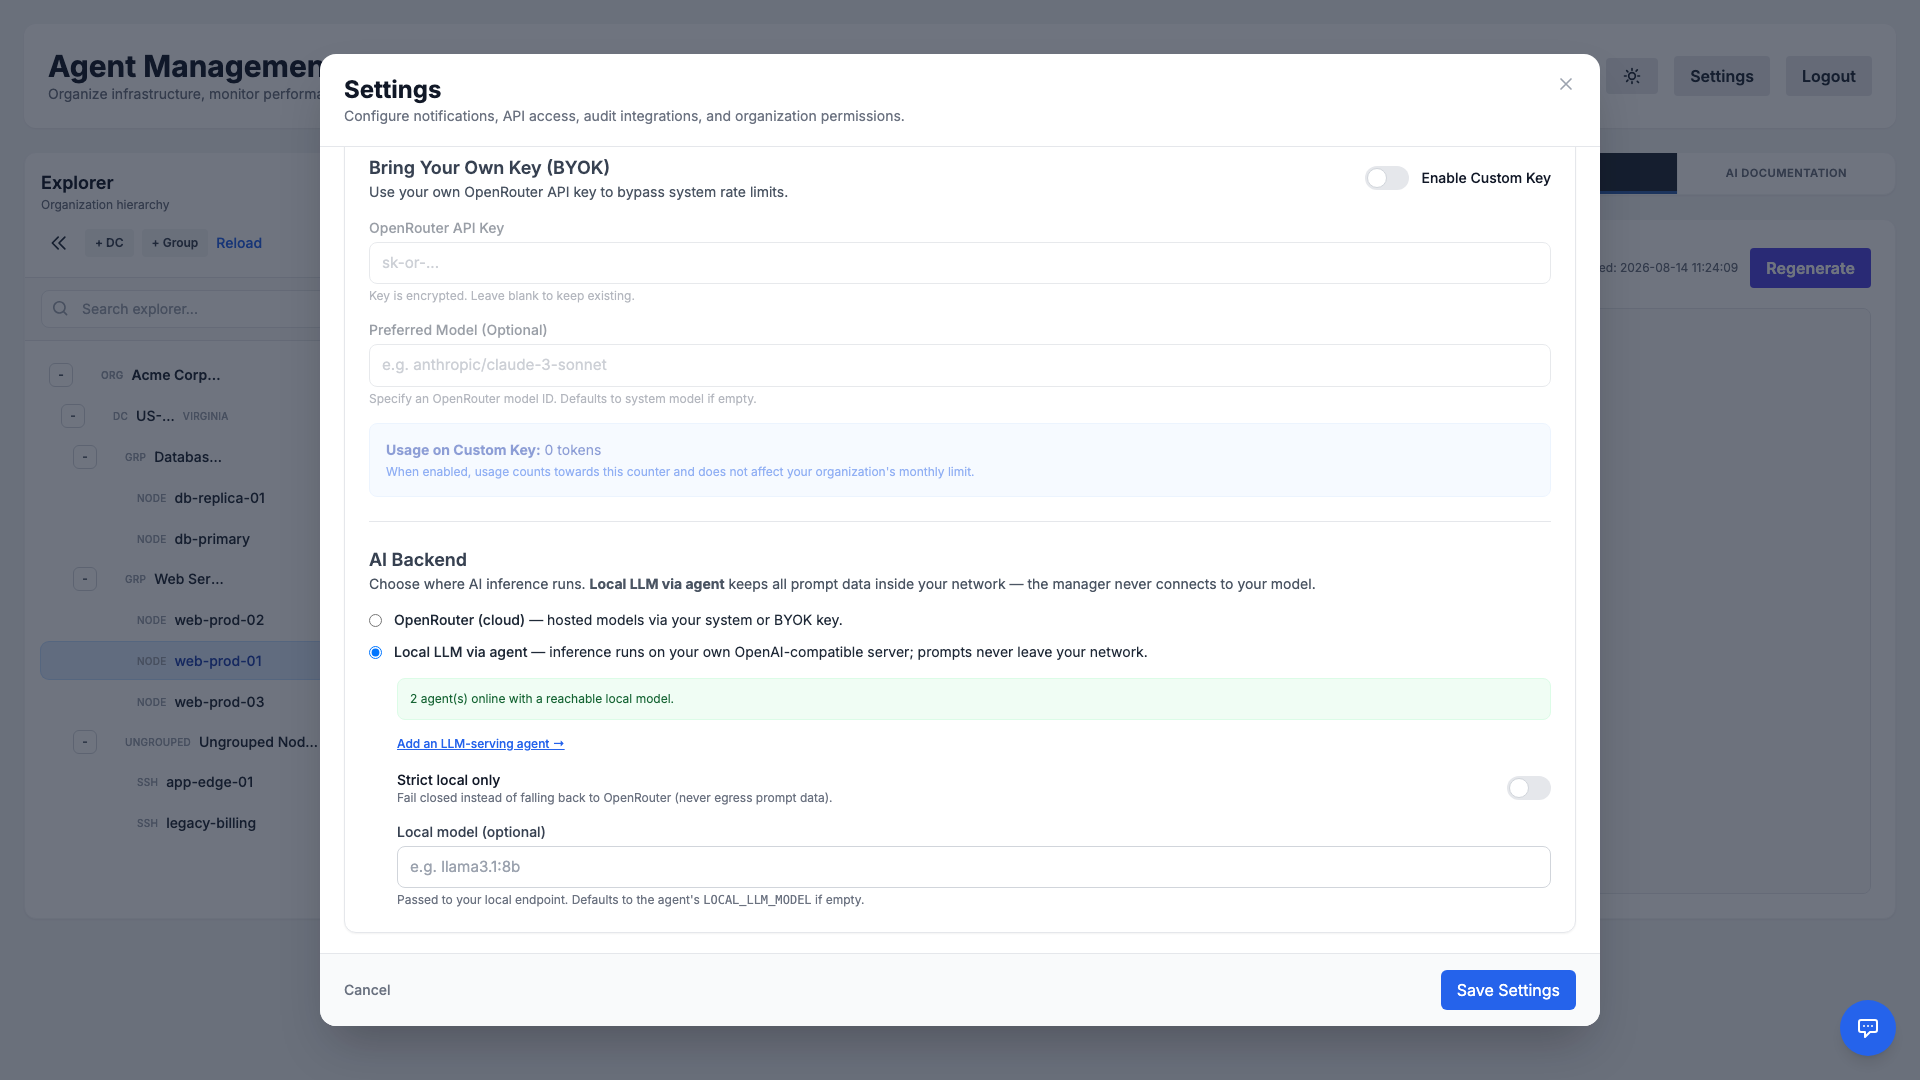
Stand up a serving agent
In Add Hosts → Install agent, choose the Local LLM backend installation type and point it at your model's endpoint (for example http://127.0.0.1:11434/v1 for Ollama). The installer bakes LOCAL_LLM_BASE_URL (and an optional model and API key) into the agent's service so it can serve inference locally.
Choose the backend
From Settings → Plan → AI Backend, switch your organization between OpenRouter (cloud) and Local LLM via agent. The panel shows how many agents are online with a reachable local model, and the AI chat streams tokens live as your local model produces them.
- SSRF-safe: The agent only ever calls its own preconfigured endpoint — never a URL taken from a message — so a rogue message can't turn it into a proxy.
- Strict local only: Enable this to fail closed — if the local model is unavailable, requests are refused rather than falling back to the cloud, so prompt data is never sent to a third party.
- Resilient: Requests spread across all of your eligible agents and prefer one with a reachable model; unless strict-local is on, a local outage transparently falls back to OpenRouter.
End-to-End Command Signing
Command Signing lets your agents cryptographically verify that every command truly came from your organization — so that even a fully compromised manager cannot forge, tamper with, or widen what your agents run. Your organization's private signing key (Ed25519) is generated and stored only in your browser and is never sent to the manager.
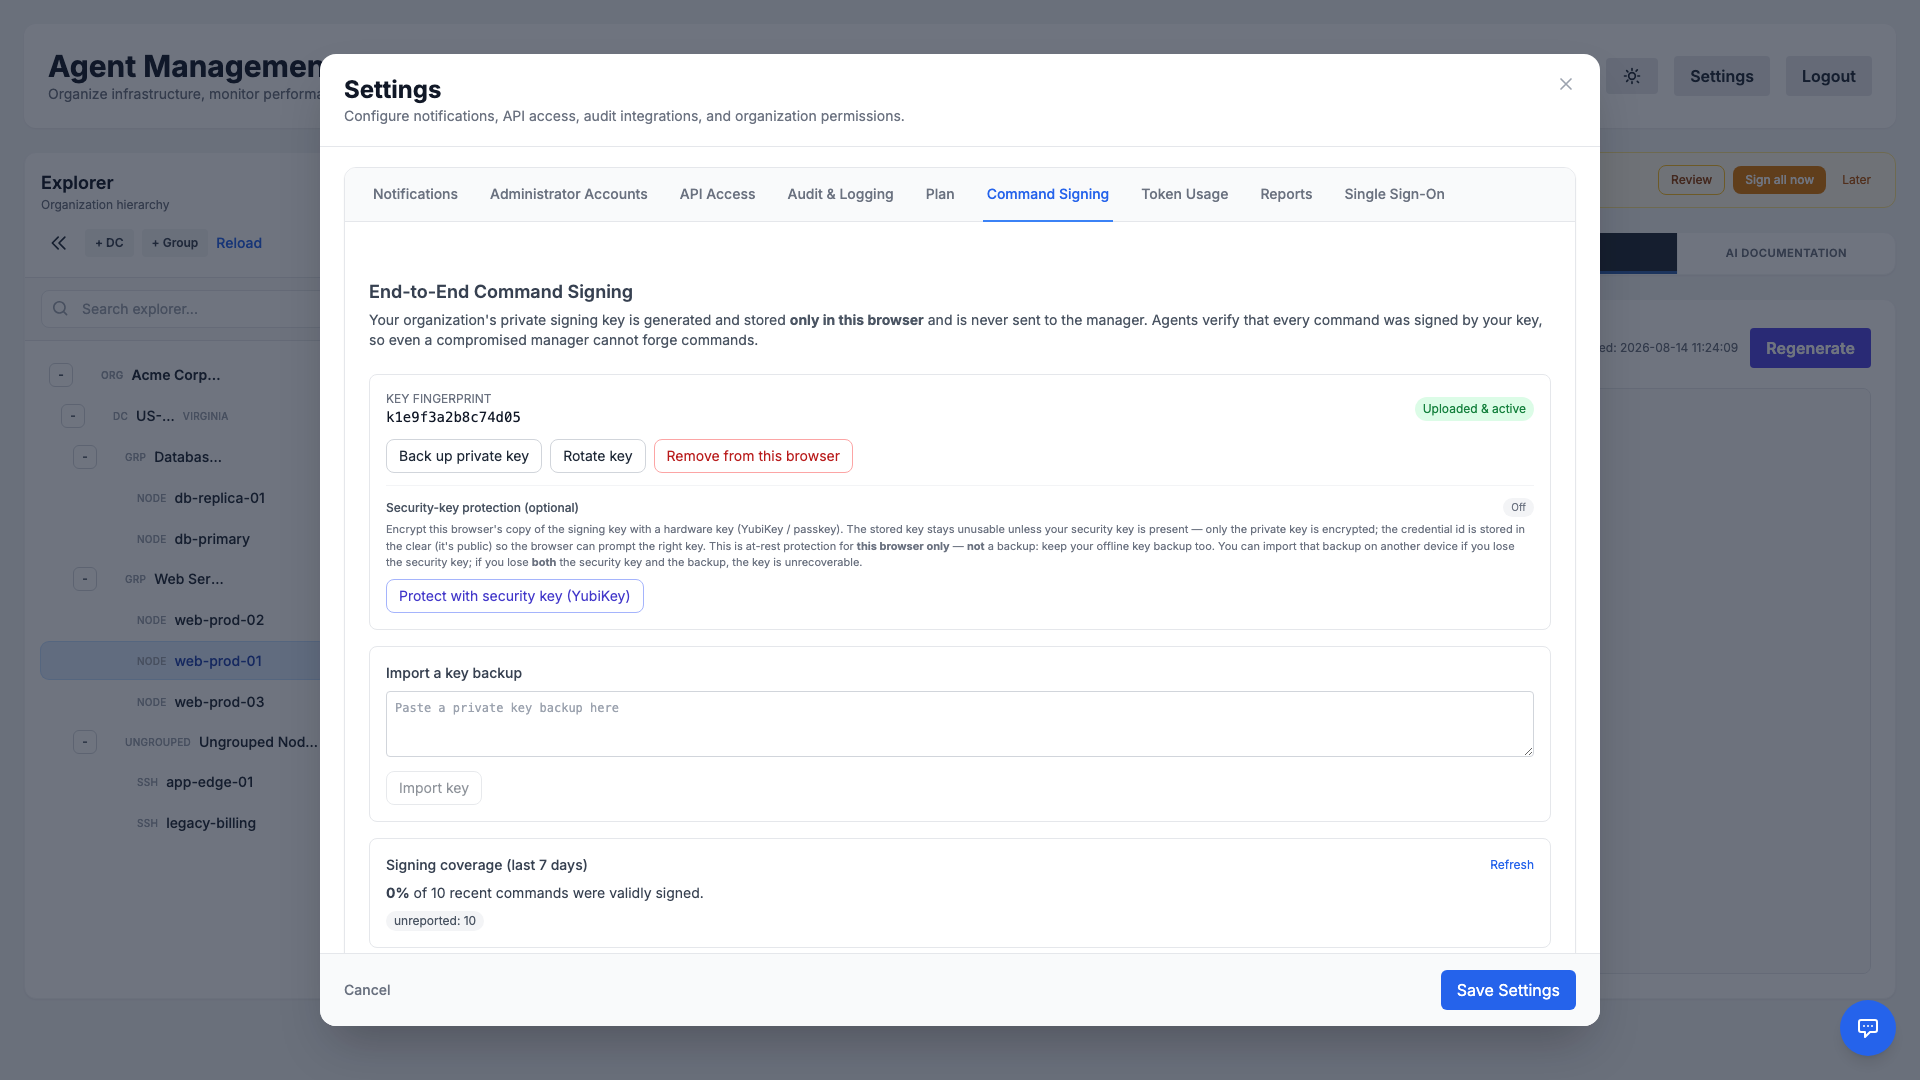
- Browser-held key: Generate the key on your device, then back it up — it cannot be recovered if lost. Import the backup on any other device you sign from.
- Verify, rotate, revoke: The manager stores only the public half. Rotate the key or remove it from a browser at any time.
- Signing coverage: See what share of recent commands were validly signed, and one-click sign your automations — Ansible schedules, remediation rules, and Terraform schedules — so they run signed too.
Per-admin keys, hardware protection & enforcement
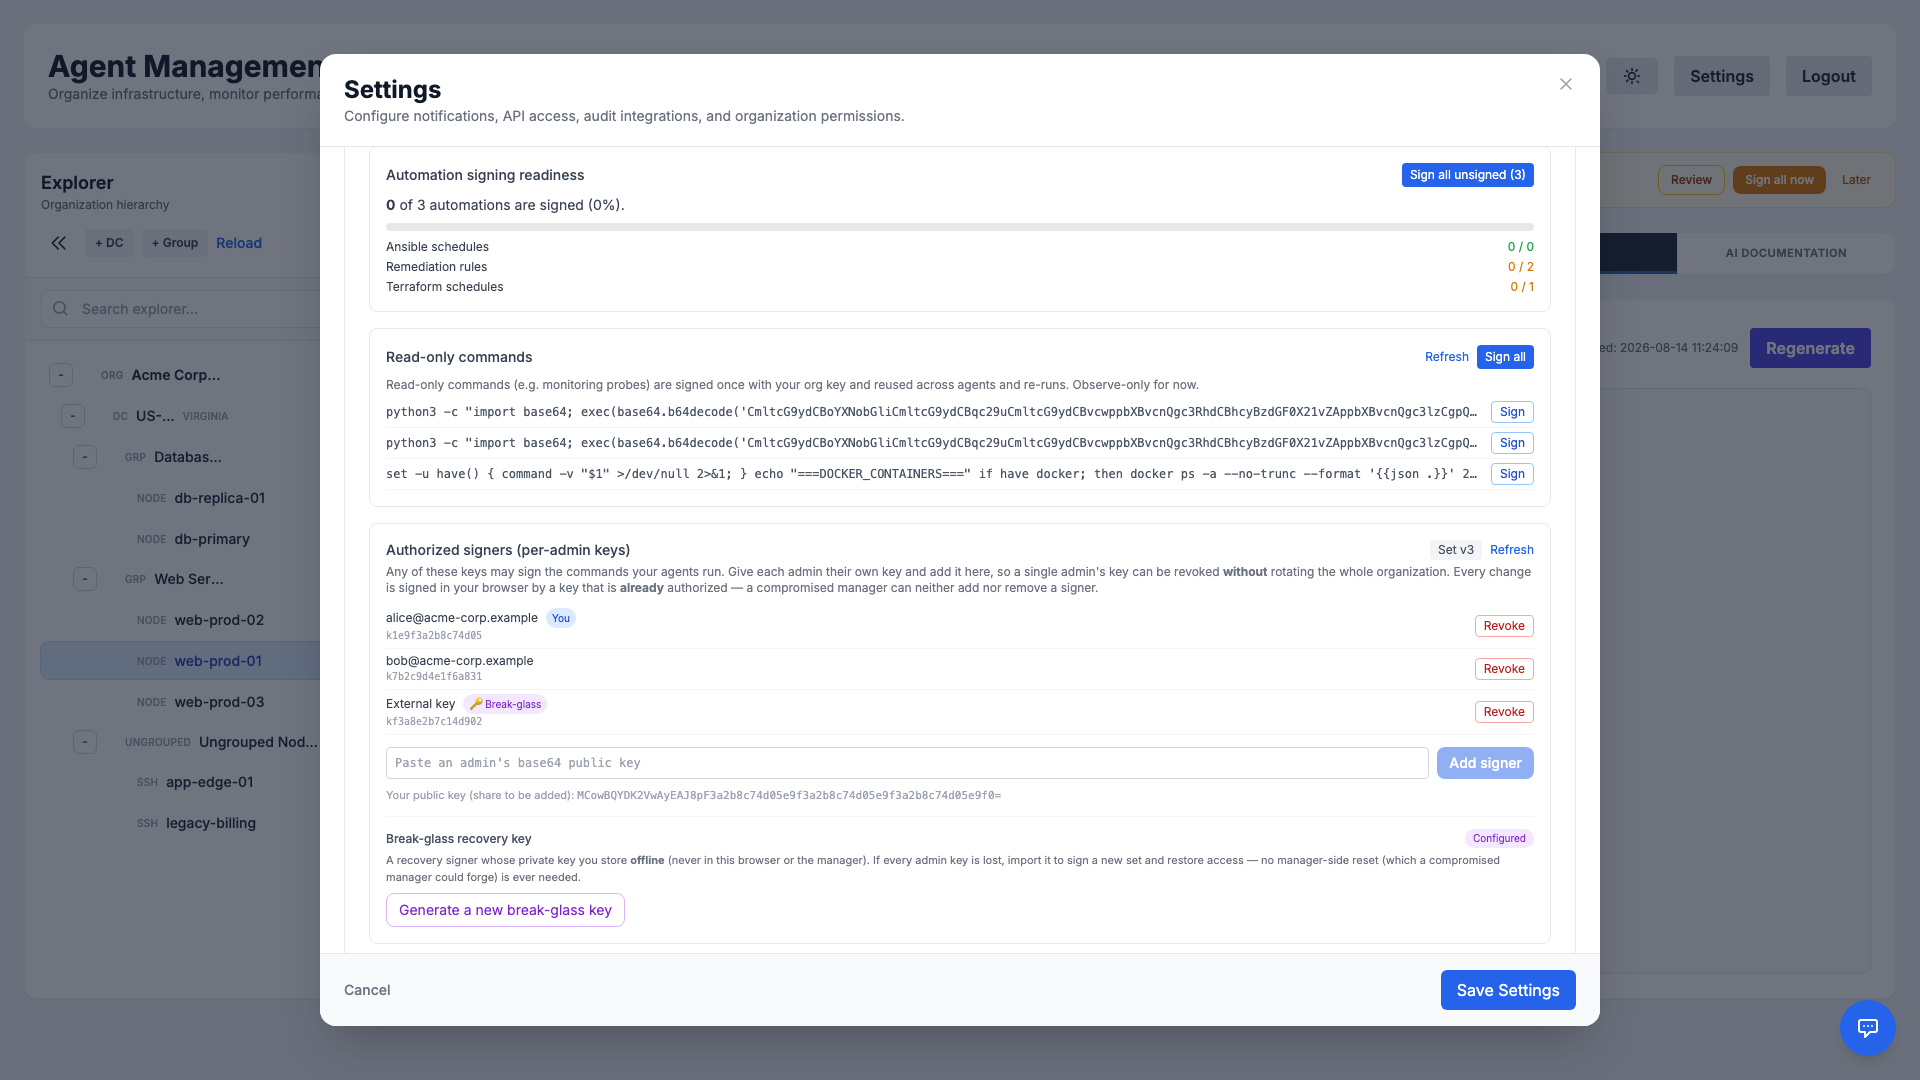
- Authorized signers (per-admin keys): Give each administrator their own signing key and add it to the organization's signer set, so any of them can sign the commands your agents run. A single admin's key can be revoked without rotating the whole organization, and every change is co-signed in the browser by a key that is already authorized — so a compromised manager can neither add nor remove a signer.
- Security-key (YubiKey) protection: Optionally encrypt this browser's copy of the key with a hardware security key or passkey (WebAuthn). The stored key stays unusable unless your security key is present — at-rest protection for that device, on top of your offline backup.
- Break-glass recovery: Generate a recovery key whose private half you store offline. If every admin key is lost, import it to sign a new set and restore access — there is never a manager-side reset a compromised manager could abuse.
- Enforcement modes: Move from Observe (report only) to Soft (report what would be rejected, still runs) to Hard (agents reject any command whose signature doesn't verify). Sign your backlog first, then enforce.
Token Usage
Understand and control your AI consumption. The Token Usage tab visualizes how many tokens your organization has used over time, broken down by activity.
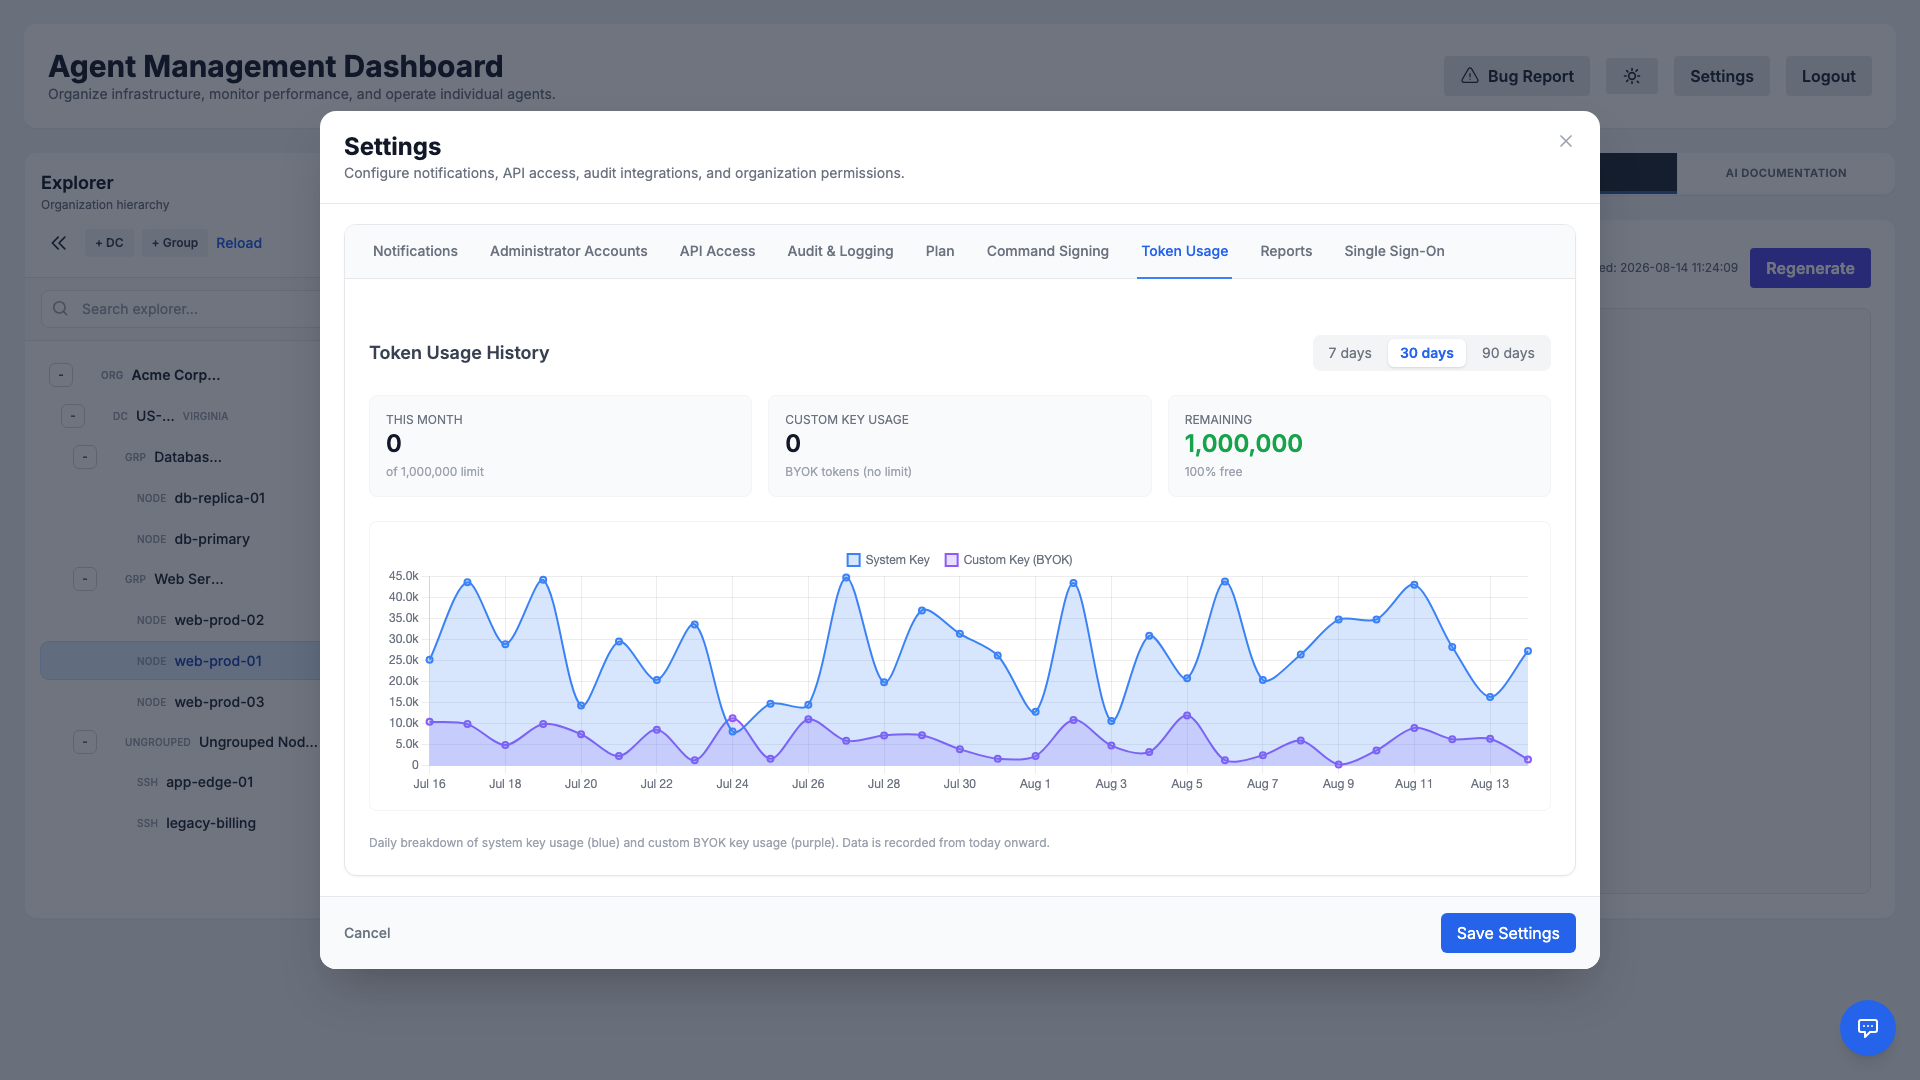
Use these insights to forecast costs, spot unusual spikes, and decide whether to bring your own AI key (see BYOK) for unlimited usage.
Operations Reports
Produce shareable operations reports covering fleet health and incident metrics for your organization. From Settings → Reports you can download an on-demand report or schedule recurring email delivery.
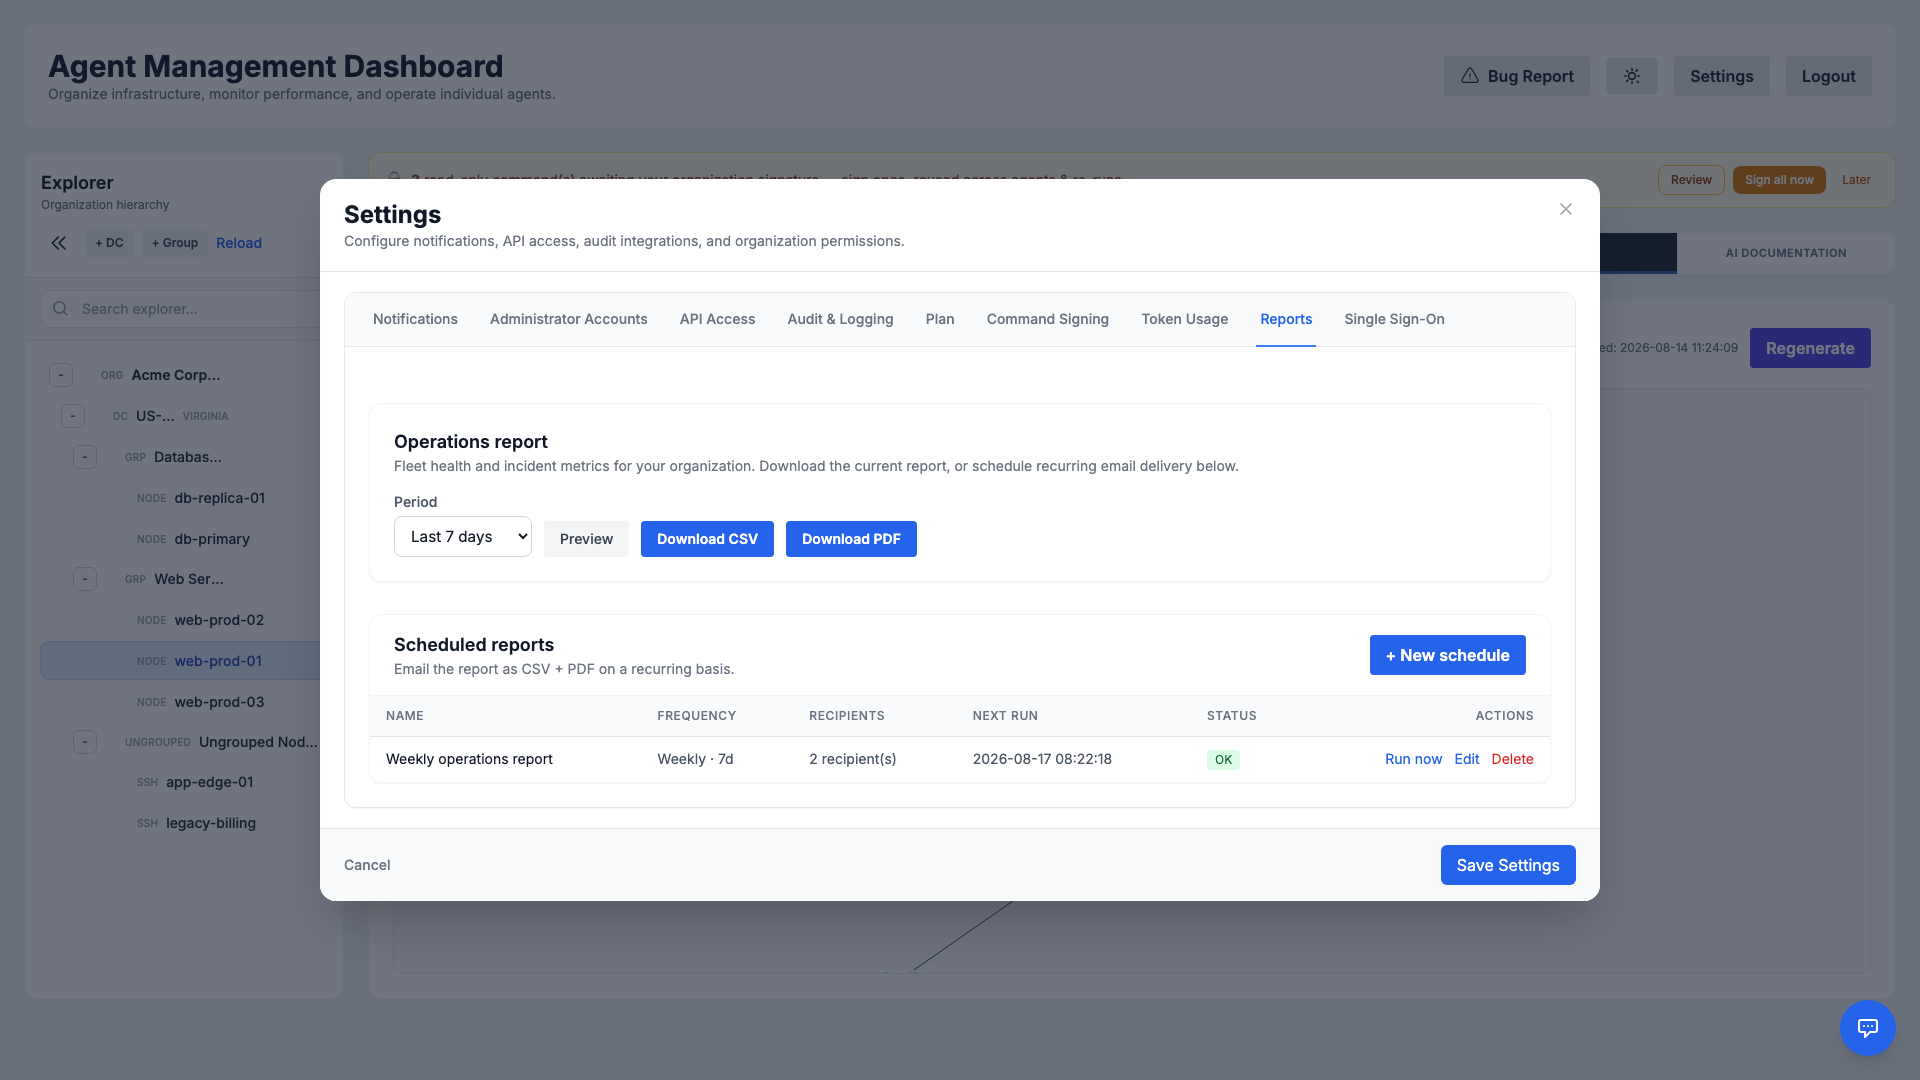
- On-demand: Pick a period (e.g., the last 7 days), preview it, then download as CSV or PDF.
- Scheduled delivery: Create recurring schedules that email the report (CSV + PDF) to one or more recipients on a daily, weekly, or monthly cadence.
- At-a-glance status: Review each schedule's frequency, recipients, next run time, and last run status, and run any schedule immediately.
Single Sign-On (SSO)
Streamline access and centralize identity with Single Sign-On. Administrators can connect the platform to an external identity provider so users authenticate with your organization's existing credentials.
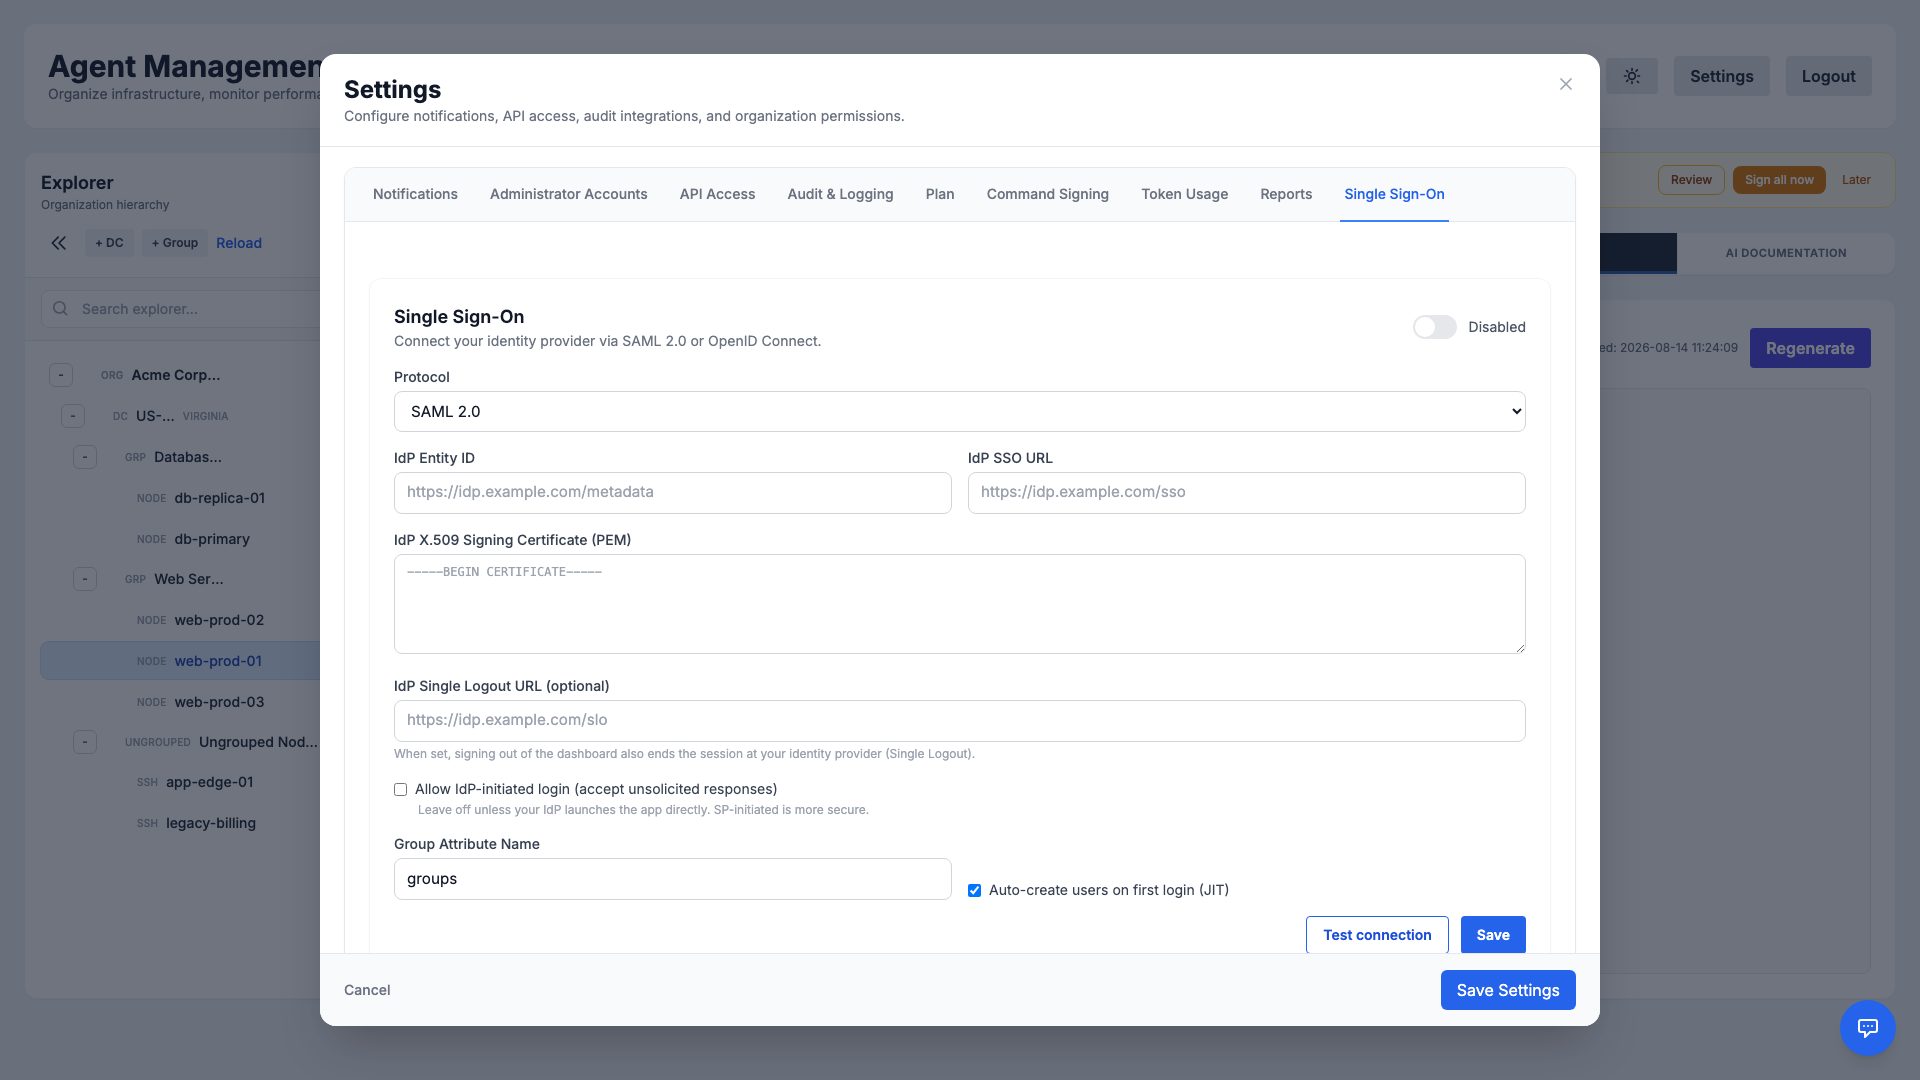
SSO reduces password sprawl, enforces your organization's authentication policies, and simplifies onboarding and offboarding of team members.
Agent Auto-Update
The agent is designed to be self-maintaining. It automatically checks for updates every 5 minutes.
Update Process
- Check: The agent polls the central server for a new version.
- Download: If an update is found, it securely downloads the package over HTTPS.
- Verify & Install: Dependencies are checked, and the package is installed automatically (via systemd or Scheduled Tasks).
- Restart: The agent restarts itself to apply the changes seamlessly.
Note: The agent uses a jitter mechanism (random delay) on startup and reconnection to prevent "thundering herd" issues on the server.
Bug Reporting
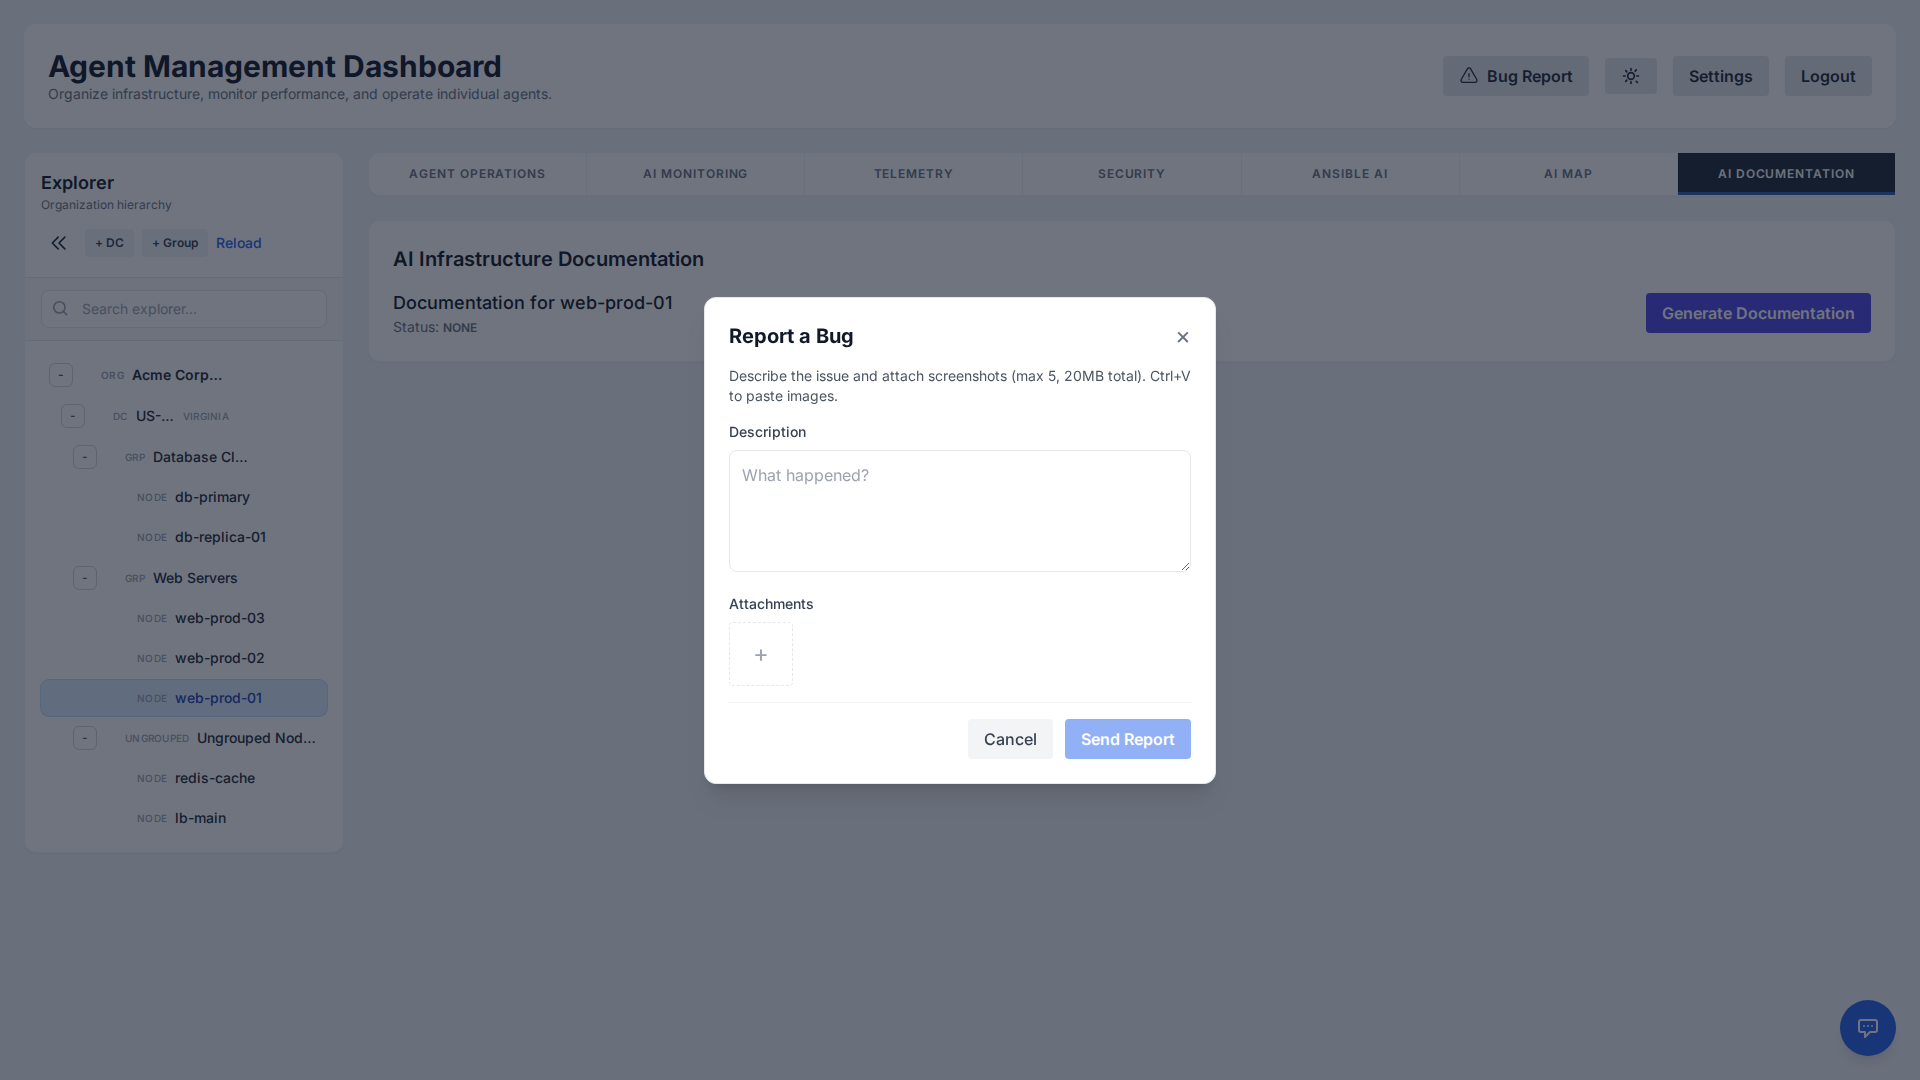
Encountered an issue? You can report bugs directly from the dashboard or API.
Requirements
- Format: Only image files (screenshots) are accepted.
- Limit: Maximum 5 files per report.
- Size: Total combined size must not exceed 20MB.
Reports are automatically sent to our support team with diagnostic context.
Troubleshooting
Linux Agent not connecting?
- Check if the service is running:
systemctl status ai-linux-agent - View logs:
journalctl -u ai-linux-agent -f - Ensure outbound traffic to port 443 is allowed.
Windows Agent not connecting?
- Check the Scheduled Task "AI System Agent".
- View logs located at
C:\ProgramData\AI System Agent\Logs\agent.log - Ensure outbound traffic to port 443 is allowed and PowerShell scripts are not blocked by strict Execution Policies.